Typhoon Surigae powering up in the Western Pacific
Intensification into a Super Typhoon possible
I’m back after a long hiatus but with a new, fresh perspective on weather and climate. Over the past 20-years, I have processed untold terabytes of weather model data, first doing my graduate research (MS/PhD at Florida State) and then in the private sector building and managing maps and data for various outfits. Yet, even with all of that experience, I am still mesmerized and awed by the weather and would not think of doing anything else for a day job or my free time. So, that’s my commitment to this blog space — I’m hoping to share inspiring things that pique my curiosity and love for weather & climate mainly through data visualizations. Weather is beautiful. Weather is art — that’s the brand I’m going for as a writer.
Sadly, Twitter is no longer the best forum for weather, and I never invested much time on Facebook. Perhaps that will change. But, I certainly see the potential of Substack’s long-form blogging tools from a journalistic point of view. I have unlimited content available for sharing and am eager to develop new or adapt data visualizations and tools to tell a story.
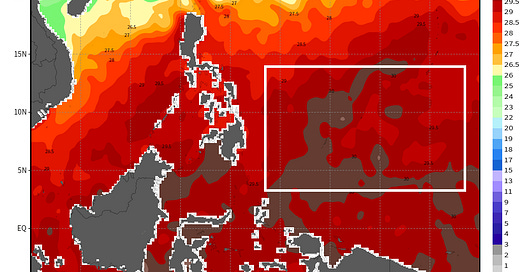
Ocean Temperatures in the Western Pacific Tropics remain very warm year round
The slow, but steady intensification of Tropical Storm Surigae (02W) just SSW of Yap (a little island) is a typical development we see in the Western Pacific even in April. The Typhoon “season” knows no bounds and powerful storms have been observed year round. Why? The ocean temperatures in the western “warm pool” remain plenty sufficient for the most intense tropical cyclones.
This map is the actual observed sea-surface temperatures around the Philippines with values of 29°C to over 30°C along the equator to at least 15°N latitude. Not only is the surface warm, but the warmth extends to depths of 50-100 meters, or more.
The SST map is generated from a NOAA product called OISSTv2 that provides a continuous record from 1981 using satellite or remote sensing retrievals from AVHRR on our polar orbiting satellite constellation. That’s 40-years+ of constant data forming a robust climate data record (CDR). Remember, it’s the actual SST not the anomaly from climatology that physically powers the storm. An “anomaly” does NOT do anything — something I’m going to repeat ad nauseum.
Satellite imagery
Above is the full-disk image from the Himawari-8 satellite of the Western Pacific showing the developing Typhoon. This is a Japanese satellite with similar instruments as GOES 16 & 17 observing the Western Hemisphere, and we get new imagery very often, in some cases with “floaters” 1-minute at high resolution (0.5-kilometers) in the visible. The site I look at for these satellite images is hosted at Colorado State CIRA (Link) and their SLIDR interface is an awesome tool.
Satellite intensity algorithm
Once the Typhoon develops an eye, especially the ones that undergo rapid intensification (RI), I look at the Automated Dvorak Technique (ADT) to diagnose the intensity of the storm — wind speed and central pressure. This is the site / tool that I often report on Twitter to provide a real-time intensity measure of Category 4+ hurricanes and typhoons. In lieu of in-situ aircraft reconnaissance, this is what is used to determine storm intensity.
Side note: this tool can be applied to ALL satellite imagery over the past 40-years+ and researchers have created a homogenous long-term record of satellite derived tropical cyclone intensity.
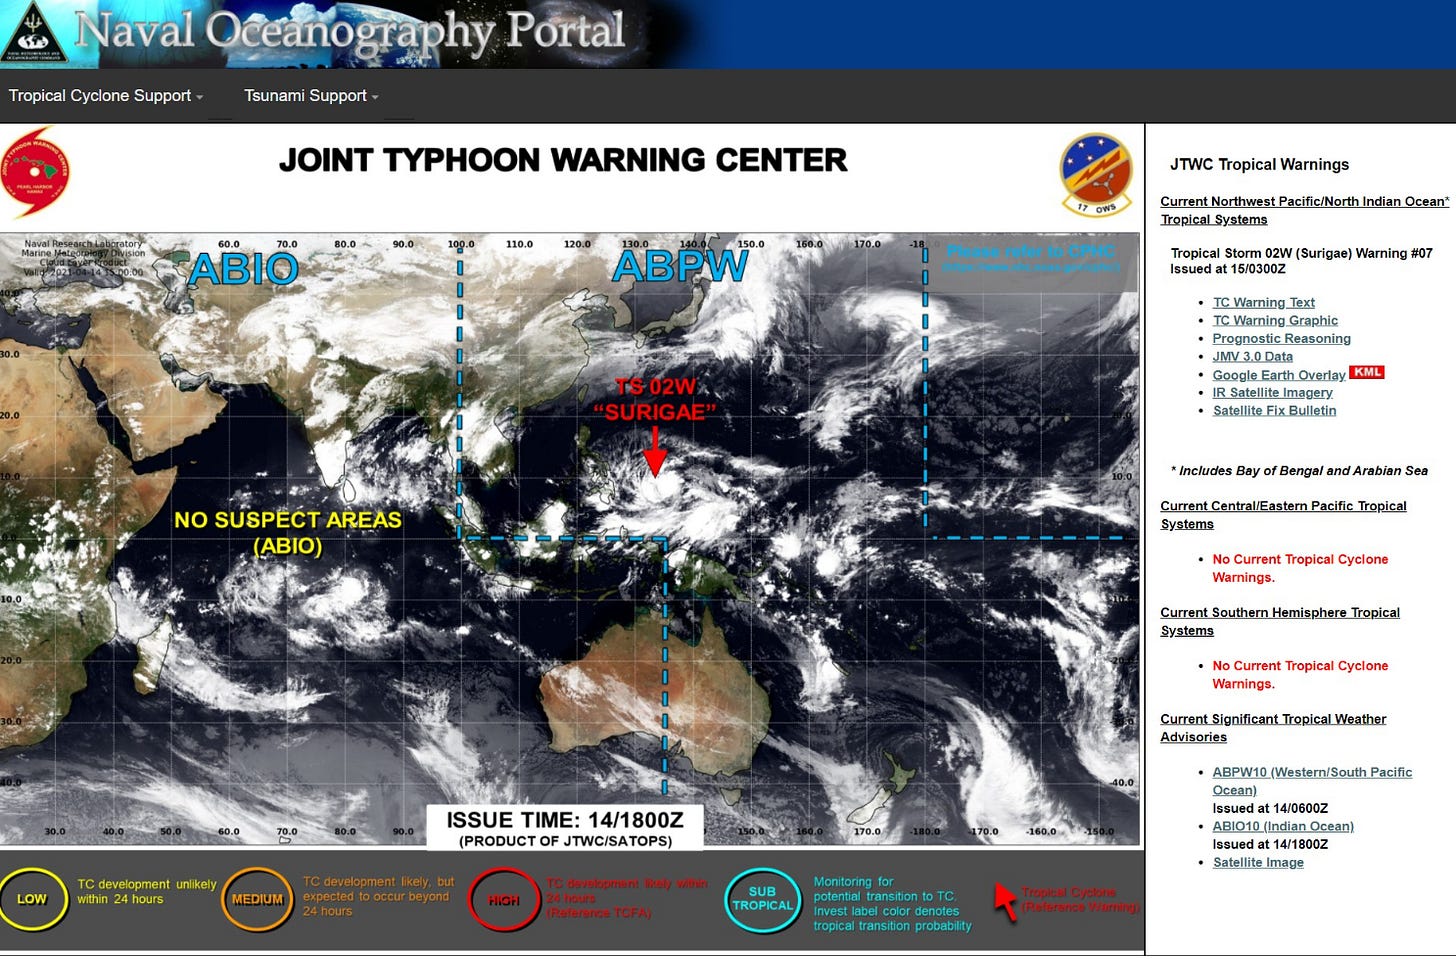
Joint Typhoon Warning Center (JTWC)
The JTWC is the US Navy’s tropical cyclone advisory and warning service that includes the Indian and Pacific Oceans as areas of responsibility. They are like the National Hurricane Center for the Atlantic Ocean, and issue forecasts multiple times per day for Typhoons. It can get very busy out there in the summertime.
I’m sharing the current forecast track (April 15, 2021 03UTC) that has Surigae “recurving” just east of the Philippines, hopefully avoiding land altogether. Of course, this forecast can change, but I think it’s a good bet populated land is avoided altogether. The forecast discussion is a great way to learn about technical items related to tropical meteorology and forecasting typhoons but from another perspective compared to Atlantic hurricanes at NHC.
Weather Models
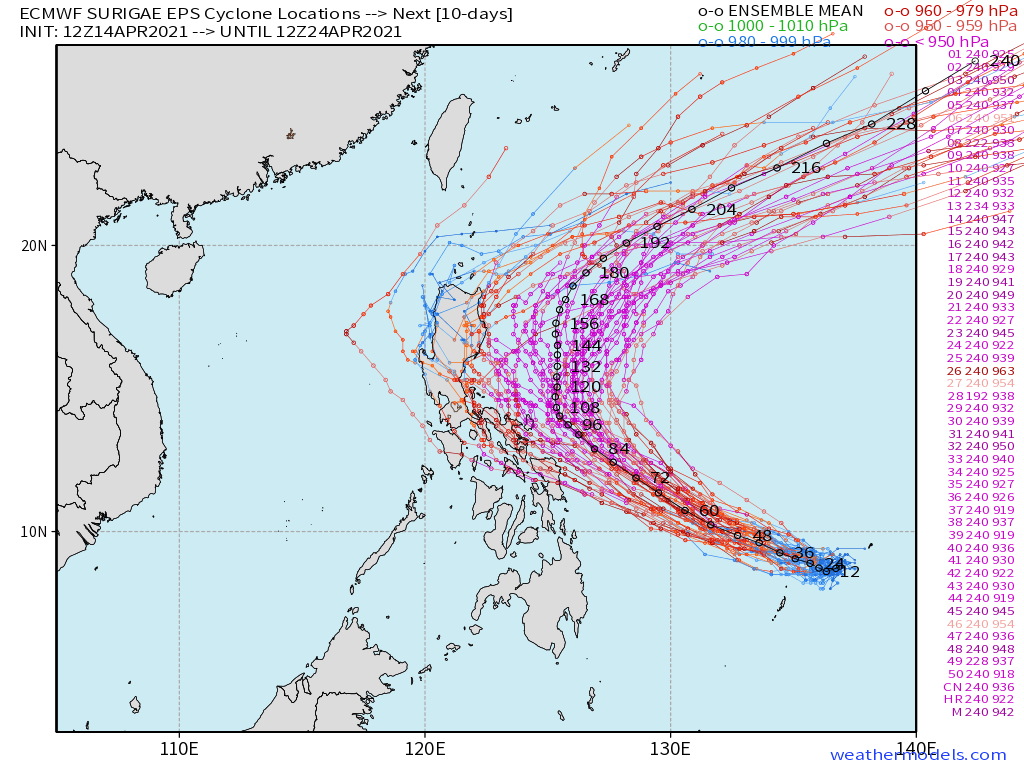
Of course, I must show some model guidance that informs meteorologists about the forecast track of Surigae.
The first place I look is the ECMWF EPS or the “Euro” ensembles, but I’m sure we’ll be using the GFS/GEFS suite much more in the coming months as it is the major new improved modeling system from NOAA.
Anyways, you can see from the black line within the “spaghetti” — the mean location — that Surigae SHOULD recurve safely east of the Philippines. But, you might wonder why should we ignore the ensemble members (out of a total of 52) that head westward? The simplest explanation is that there is a spread of results that encompass possible solutions to the west & east, and when you average them out, you get the most likely solution. Ensembles are incredible tools — and I’ll surely be talking a lot more about them. Note from the purple color and the column of central pressure minimums that Surigae is expected to reach as low as the 920s mb — and in model world — that’s probably a Super Typhoon (130-knots+). JTWC maxes out at 115-knots, but they are infamous for their conservative intensity forecasts.
The ECMWF ensemble spaghetti is shared from Weathermodels.com where I warehouse a vast treasure trove of weather model forecast guidance.
I’ll be updating the Typhoon during the coming days — and describing how these Western Pacific storms thousands of miles away can affect weather over North America AND mess up our medium range forecasts (5-7 days+).
Other blog topics in the Draft stage:
Atlantic hurricane seasonal forecast
Global temperatures from reanalysis
Weather model skill: ECMWF vs. GFS
And, I’m open to suggestions about anything readers may find interesting.


