


Rapid intensification of Hurricane Otis
72 mb pressure drop in 24 hours
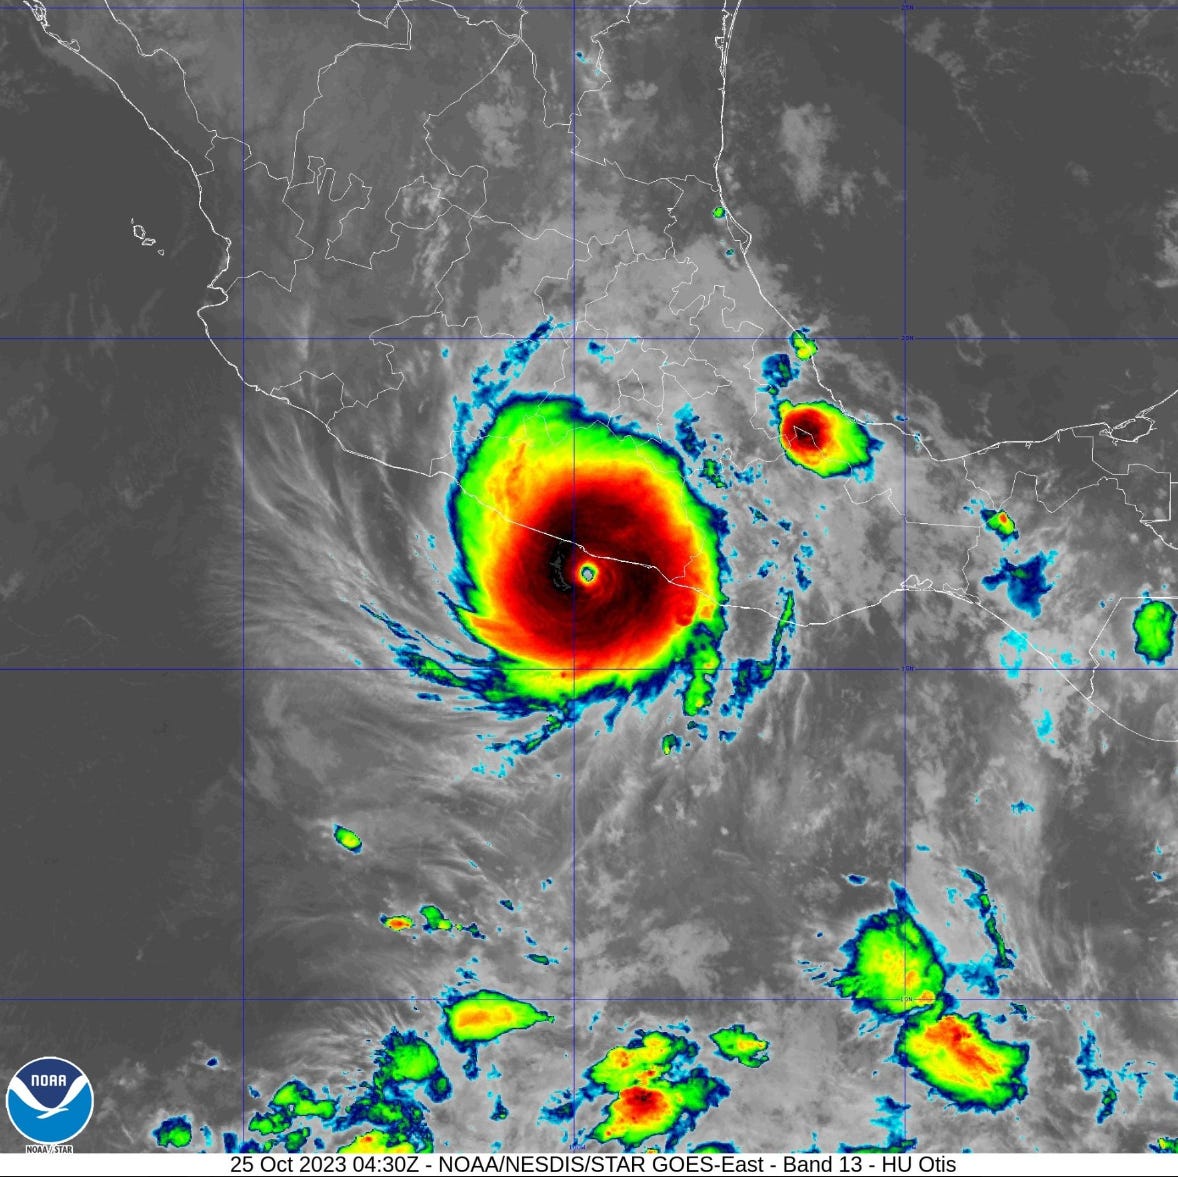
The explosive intensification of Hurricane Otis was certainly a surprise to forecasters and computer models alike. The working best track from NHC shows the winds increasing from 55-knots to 145-knots in 24-hours for a 90-knot increase. That’s TS/H1 to Cat 5 in 18-24 hours.

The central pressure fall from 995 mb —> 923 mb is 72 mb in 24-hours or a rate of about 3 mb/hour. In comparison, Wilma (2005) dropped 100 mb in 24-hours, so Otis is in rather rare company.
Global weather models across the board failed to indicate the exceptional intensification of Hurricane Otis. However, HAFS — NOAA’s new hurricane model — did have a couple forecast runs that showed rapid intensification earlier on Tuesday, but not to this exceptional level. The SHIPS rapid intensification diagnostics were not indicating the explosive deepening.
Environmental Factors
The sea-surface temperatures off the coast of Mexico were in the 29°C - 30°C range, but that is not abnormal even for the last week of October. This part of the Eastern Pacific is the last to cool off in the autumn and remains a “hot-spot” relative to the rest of the basin. The ongoing El Niño certainly helps increase the latitudinal extent of > 28°C water to the Equator.

As hurricanes mix the ocean surface, cooler water from below is upwelled. The depth of the 26°C isotherm is a good indicator of the amount of “fuel” available to a tropical cyclone like Otis. NOAA AOML produces a metric called the Tropical Cyclone Heat Potential (TCHP) that integrates the ocean heat content down to the 26°C isotherm. Off the coast of Mexico, the TCHP maximum of about 100 KJ/cm2 is certainly good enough for a Category 5 hurricane. Note, the Caribbean has double the TCHP fuel and that’s why we’ve seen monsters like Gilbert (1988) and Wilma (2005) reach record low pressures. Hurricane Patricia in October 2015 is probably a good analog for Otis as an unexpected super-intensifier, also during El Niño. The SSTs were 30°C to 31°C along the coast where Patricia exploded.

Patricia SST October 20, 2015:

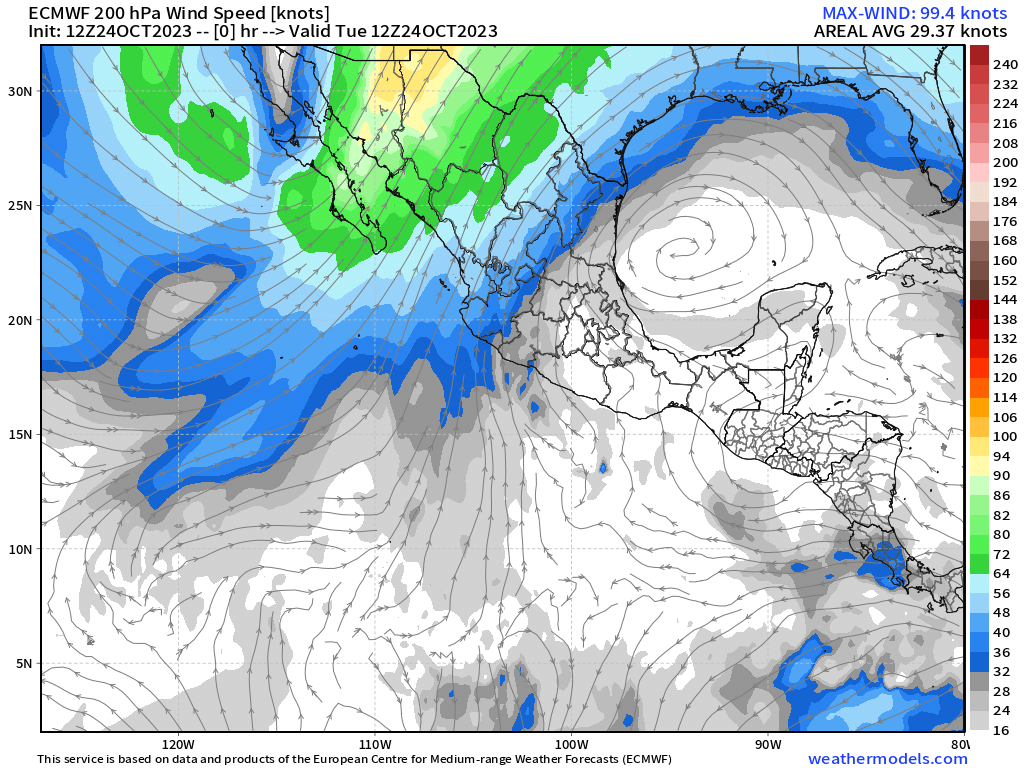
Upper-level divergence
Otis was optimally positioned in the right rear entrance region of a jet streak as shown in the 200 mb winds from 12z Oct 24 (Tuesday). This intensification process works for non-tropical cyclone as well like Nor’easters.
For Otis, this meant a low-shear, high diffluence aloft environment that accelerated the pressure falls. You can also see the 200 mb anticyclone to the northeast of Otis over the Gulf of Mexico, also optimally placed.
Right place at the right time!
Climate change connections
There are many consistency arguments that can be made irrespective of an individual hurricane like Otis — with the caveat of “if all else is equal”
Warmer ocean temperatures translates into higher potential intensity (stronger winds, lower pressures), and more efficient spin-up (rapid intensification)
More rainfall overall at a higher intensity, but jury is still out on distribution between inner/outer core regions.
Unknown change in size.
Tropical cyclones are creatures of opportunity and environmental conditions [wind shear, atmospheric humidity, lack of dust, ocean temperatures/heat] need to be as close to optimal as possible to set off explosive intensification.
Yet, even with the best possible conditions (the pump is primed), the vortex itself must be conducive to intensification during the window of opportunity. If a tropical storm can survive for many days in a disheveled state, then it has that many days to find an appropriate environmental window to spin-up further. However, during some seasons, no spin-up occurs and instead wind shear or dry air dissipates the system. Or it encounters land, of course.
It’s this interplay between the vortex and the environment that determines the lifecycle of a particular tropical storm or hurricane. Thus, the vortex and changes in the environment are intertwined.
Climate studies tend to combine the characteristics of many storms over years/decades to diagnose the impact of a warming planet over the past 40-years. However, this is probably too much of a simplification with the small sample size or number of realizations over the past several decades with good-to-excellent observational data coverage e.g. aircraft and satellite.
With those caveats, Hurricane Otis is certainly a remarkable example of a very rapidly intensifying system in the Eastern Pacific, but it is very difficult to attribute or quantify changes in its behavior or lifecycle to climate change. Of course, you cannot say that climate change caused Otis.
In my opinion, the path forward would be investigating the lifecycle behavior or each storm / hurricane independently rather than lumping them together and performing correlations with SST.
The best evidence for this approach is our rather spotty track record in sub-seasonal (2-4 week) to seasonal prediction of Atlantic hurricanes. The entire basin is constantly evolving on daily times scales with upper-tropospheric troughs (TUTTs) causing wind shear, African dust outbreaks leading to mid-level dryness, and strength + location of subtropical high pressure cells. On top of this, you have the MJO and Kelvin waves passing through the tropics.
Therefore, the hurricane season is actually a series of multiple week/2 week periods that each independently provide windows of opportunity for storms to develop (or not).
So far 2023 is a weird season around the world for a sort-of-El Niño poorly coupled to the atmosphere even into Sept/October. Hence, the Atlantic has been operating like it’s a neutral phase of ENSO. And, the Western Pacific does not look remotely like 1997 with a baseball team of Category 5 Super Typhoons.
Sorry El Niño
Outstanding overview or the El Nina situation and explanation of the cyclonic intensification process!