


May 29, 2025 Thursday Tropical Update
Aside from TD 01E (Alvin), the Northern Hemisphere tropics remain quiet

Thursday’s Tropical Weather Headlines
Atlantic tropical update: not expecting any development through at least 7-days, but LOW chance for a tropical storm in the Caribbean or Gulf of Mexico after Day 10 [into second week of June]. Ensembles in the long-range
show a Caribbean / Central American gyre circulation in early June that is conducive to spinning up tropical storms in the Eastern Pacific & Caribbean/Gulf.
Eastern Pacific tropical update: EPAC to see first storm [Alvin] today. Tropical Depression 01E has been designated, and looks well organized this morning. I suspect NHC will upgrade to Alvin shortly.
Saharan Dust / Air Layer blasting off African coast to squelch any tropical waves for a 5-7 day period across the MDR. This break in tropical wave train will last for several days across the Atlantic.
Lack of a hurricane through June 4th — means 2025 will be the latest (since 1973) to NOT see a hurricane strength tropical cyclone in the Northern Hemisphere for the current calendar year. No dice in the Western Pacific for the next 7-10 days, or who knows when. 1973 was a strong (!) La Nina.
Integrated Vapor Transport | Next 10-days
The ECMWF HRES (control) IVT model simulation for the next 10-days does not show anything spinning w/tropical designation across the Atlantic.
However, the interaction between various features could eventually spin up a system in line with June climatology as the deep layer tropical flow finally reaches a weakness in the subtropical ridge, and can gain latitude.
Precipitation and MSLP Next 10-days
The central Atlantic high pressure is large and in charge from Bermuda to Azores. The ITCZ is south of 10°N — typical climatological location for early June.
Overall Precipitation and Anomaly for 10-days


Very little precipitation falls over much of the Atlantic across the subtropics due to prevailing high pressure and lack of storm systems heading into June.
The ITCZ is less convectively active than normal (climatology).
Precipitable Water Next 10-days
My favorite parameter — sped up for 10-days. You can see the surges of Saharan Air Layers (SAL) from the African continent as wave fronts blasting westward with lower PWAT (yellow) pushing the red (2-inches+) out of the way.
High PWAT continues to collect over Central America waiting for some low-level vorticity to come along and take advantage. This model cycle (ECMWF 00z) does not show an Atlantic side development, but another storm spins in the Eastern Pacific [Barbara].
Subscribe for 2025 Hurricane Season Updates — Know what’s coming down the pike 2-weeks ahead of time.
Atlantic Basin
Eastern Atlantic Satellite Image
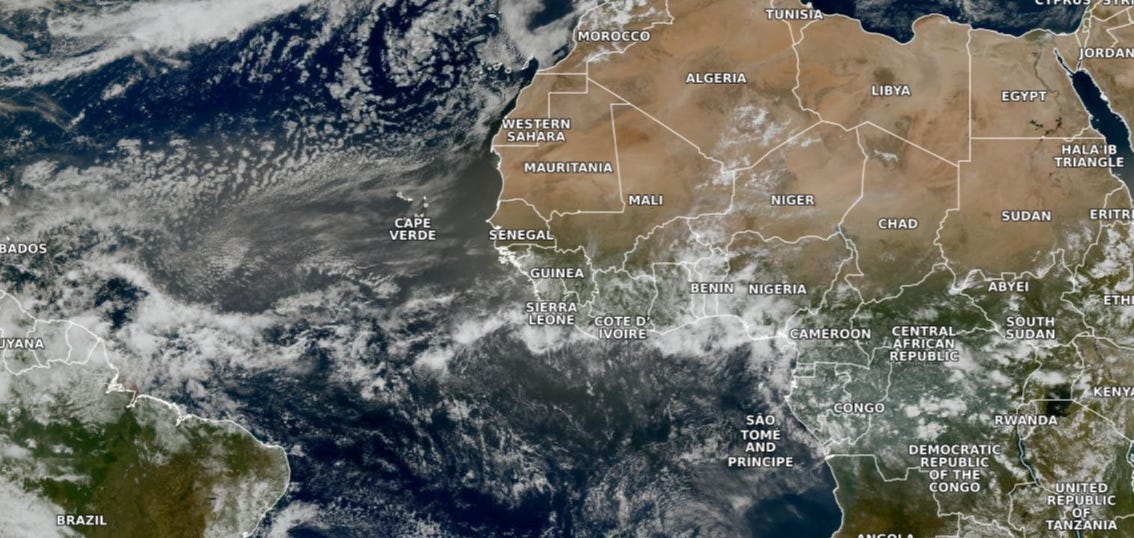
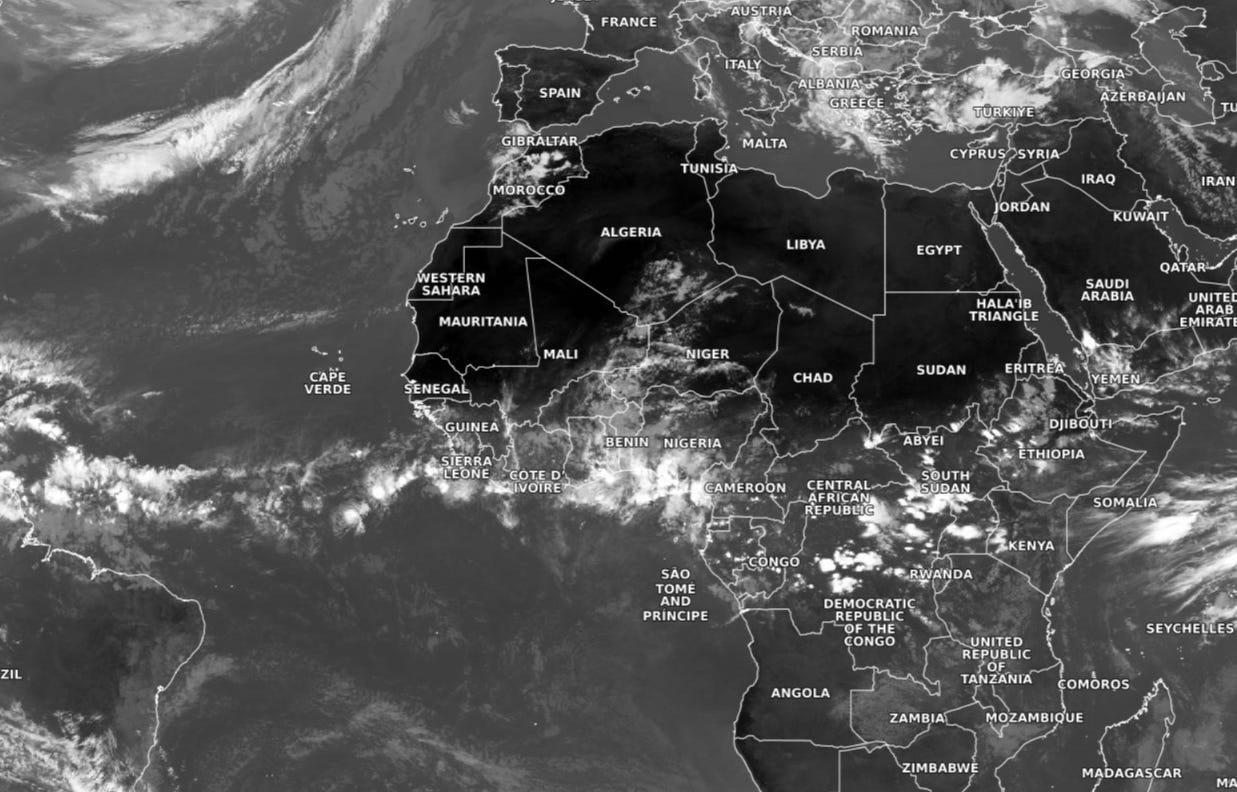
Our dust cloud over Cape Verde Islands is THICK and shows well in the “true color” satellite imagery as a brown haze.
The monsoon trough to the south of the dust off Sierra Leone was generating strong convection yesterday over the coast, but that has fizzled. I see one tropical wave over Benin/Nigeria that is convectively active.
Copernicus CAMS {ECMWF) Dust | 5-days Forecast

NASA GEOS-5 data was late arriving, so we’ll use the ECMWF version of CAMS (Copernicus program) atmospheric composition modeling for our dust cloud forecast for 5-days.
SAL + dust in the Caribbean will enter the Gulf before being diluted — fertilizing the ocean for the critters.
The major SAL spins clockwise (anti-cyclonically) into Cuba and Bahamas by middle of next week. Then, a break in SAL plumes for several days.
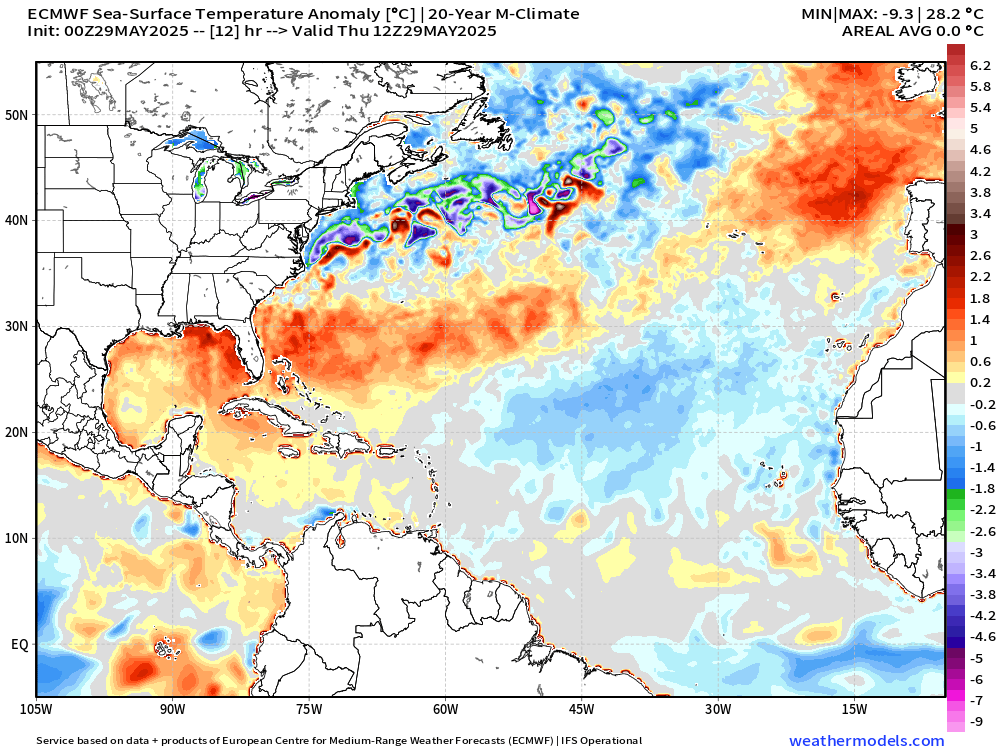
Atlantic Ocean Surface Temperatures (SST) and Anomaly
This depiction uses model (ECMWF) SSTs with a recent 20-year climatology.

Since a temperature “anomaly” can’t do anything on its own, it’s the actual temperature, we can sometimes be misled by our period of averaging. When looking at the last 20-yeras (2005-2024), we see the Atlantic is quite cool.
A more representative climatology might be 2015-2035 (21-years) or 2010-2040 (30-years) or whatever. There’s no right answer.
Looking at the rest of the globe, there’s quite a bit of BLUE (below climo) especially in the tropics.

Actual sea-surface temperatures < 26°C won’t support tropical storm genesis through normal convective pathways shutting off the MDR for a while. The Gulf and Caribbean are open for business with 28°C surface water available.
Anomaly (compared to 1991-2020) is 1-2°C above normal across the Gulf and into the Southwest Atlantic off the coast of Florida to Bermuda. However, even if it’s warmer than normal, the actual T is still < 26°C.
Important: actual Sea-Surface Temperatures (SST) help form and intensify tropical storms and hurricanes NOT the anomaly. We need sustained 26°C SST for typical tropical pathway storm development. You can see the green (under 26°C) extends still to 10°N latitude = too chilly for typical MDR development, but that will warm over the next 2-weeks to be viable.
The Caribbean is already (always) warm enough for a major hurricane (28°C). The Gulf is still chilly across the northern half of the basin.
Tropical Atlantic Satellite Imagery
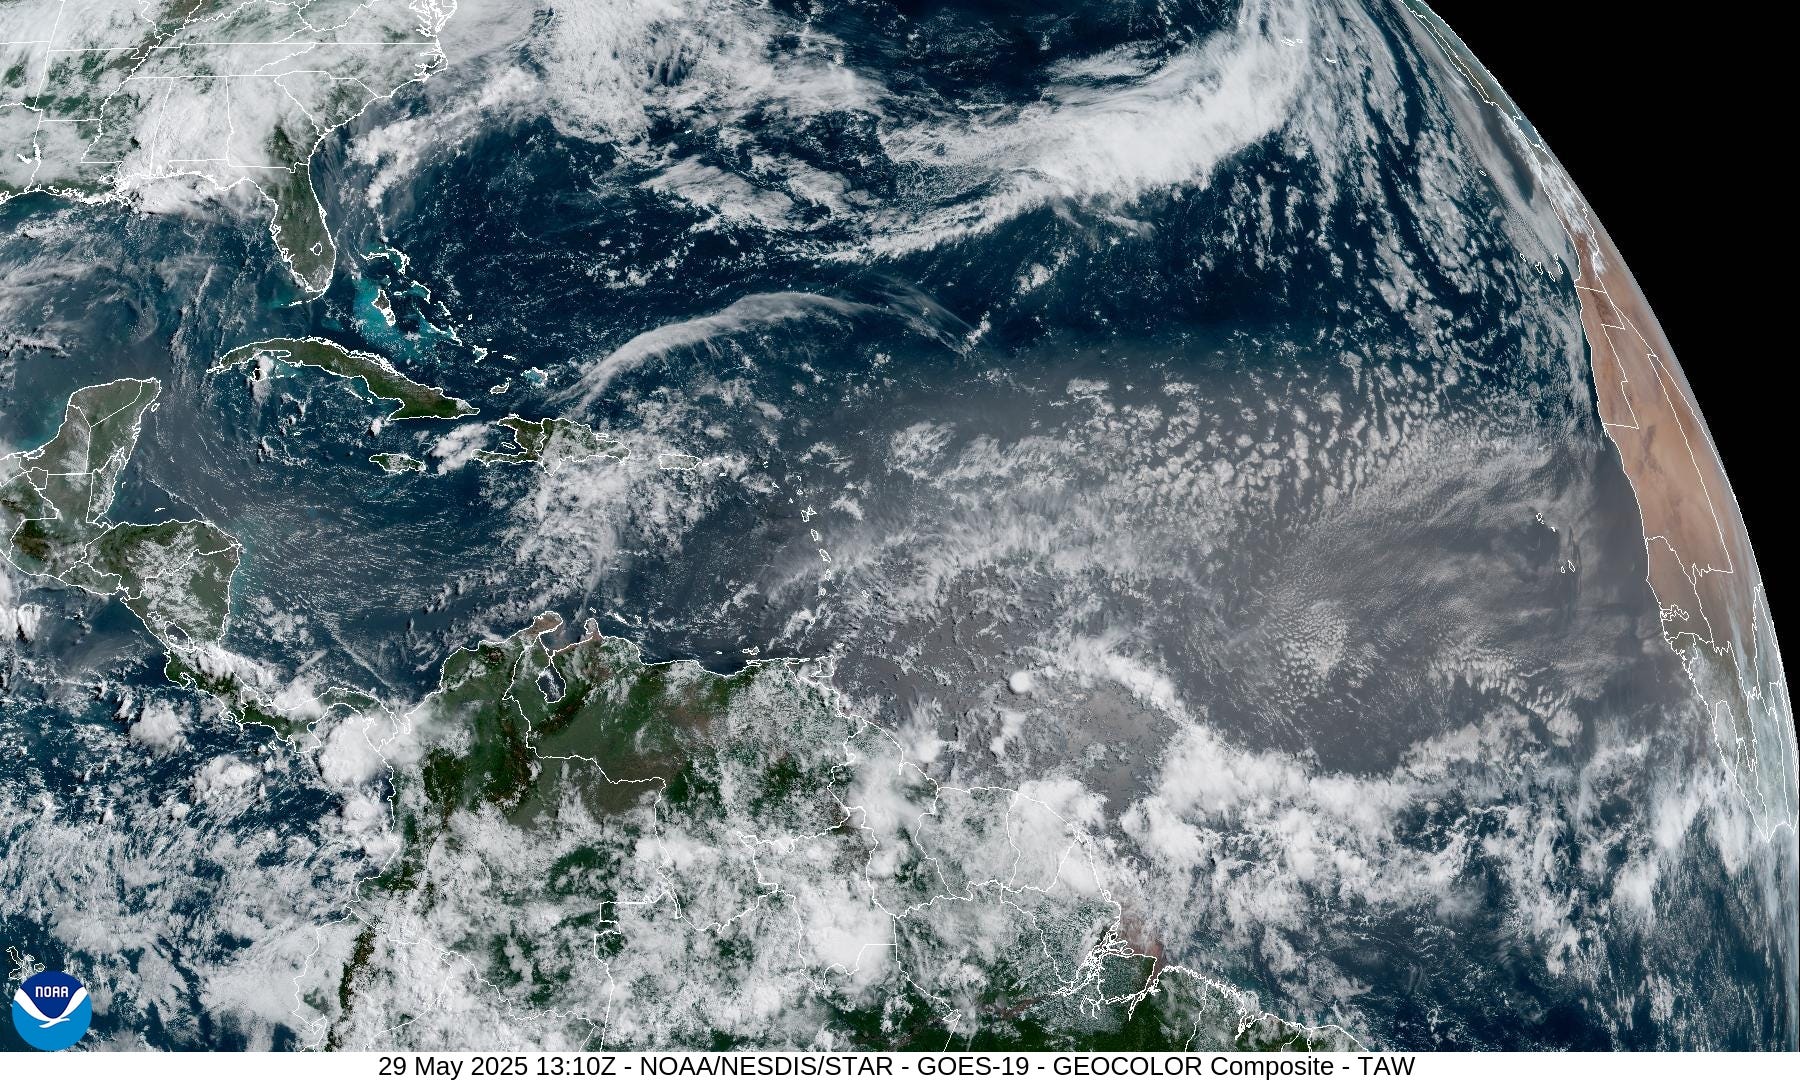
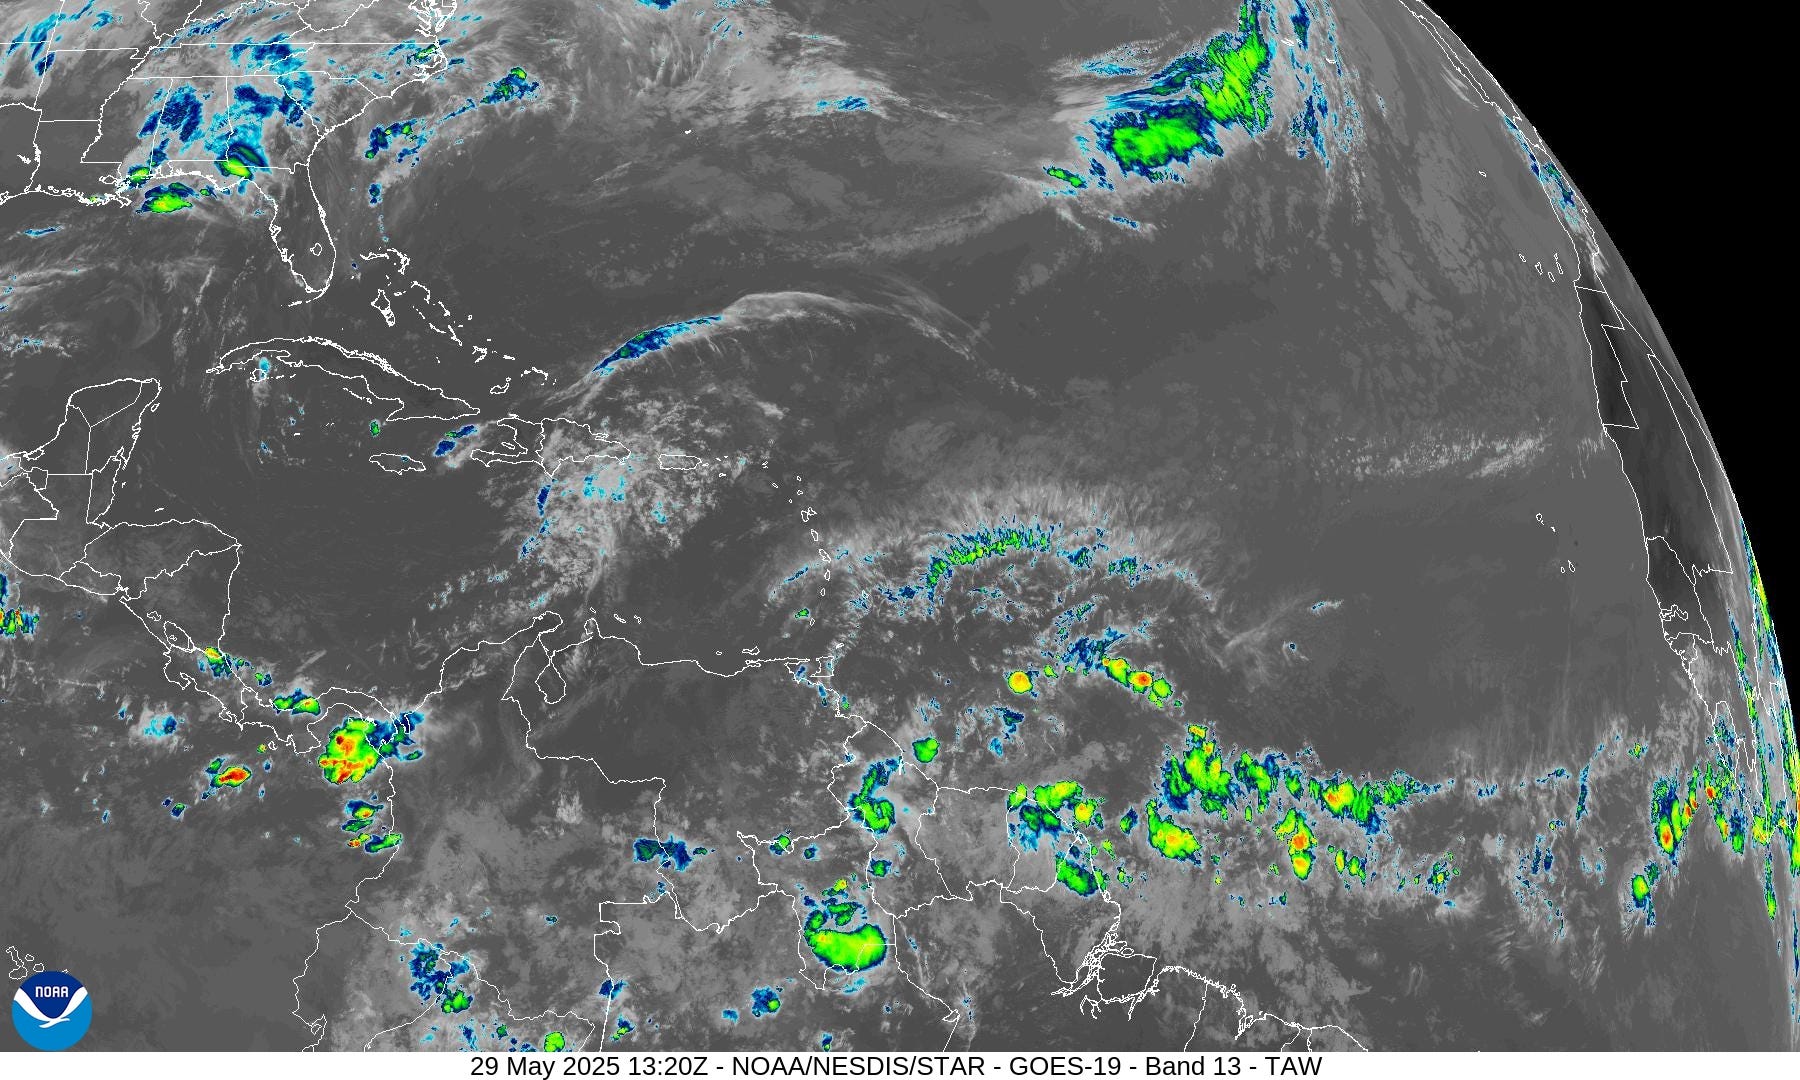
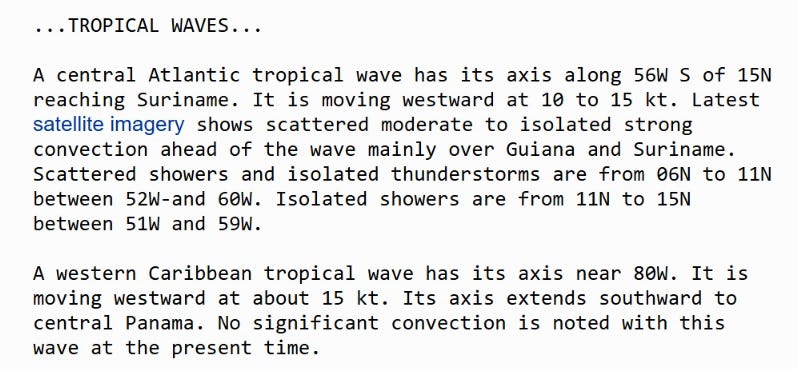
Two tropical waves — one heading through southern Caribbean nearing Panama has minimal convection. 5Convective with another wave nearing the islands and northern South America has fizzled.
Tropical Surface Analysis 06Z
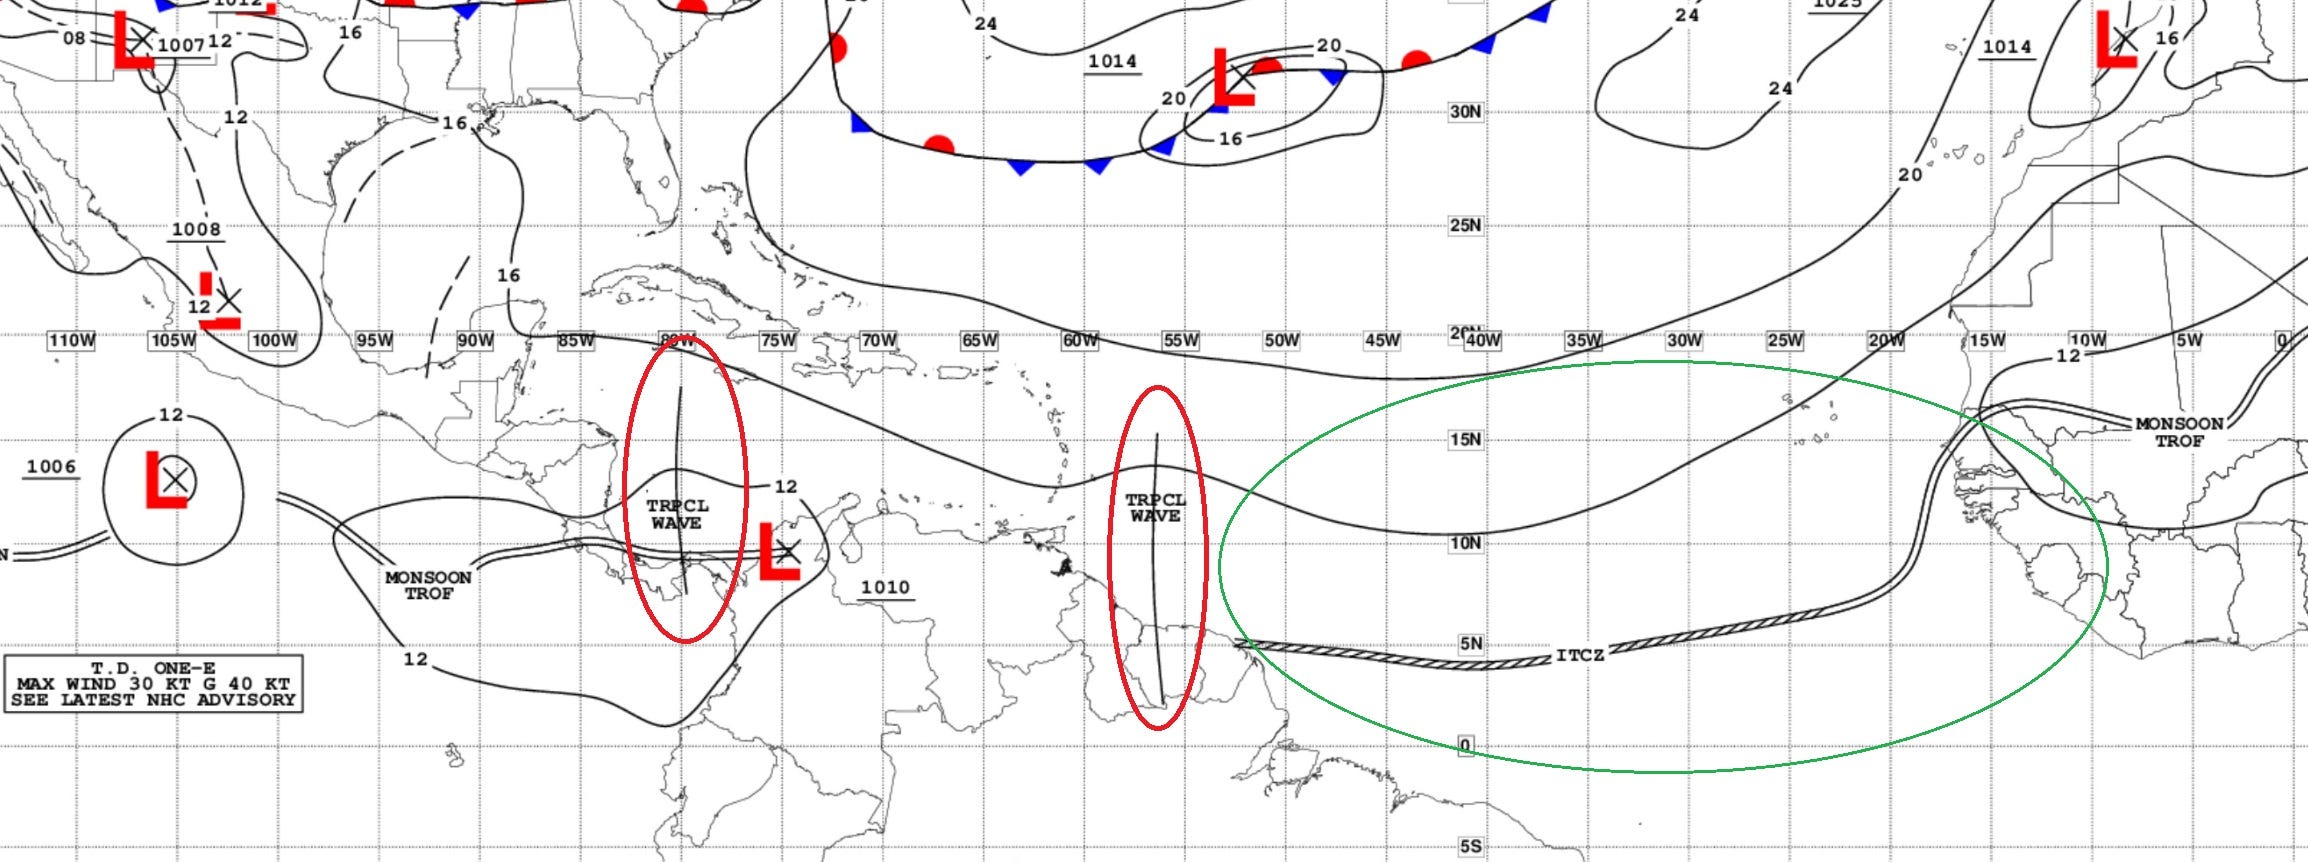
Tropical Waves = 2 but no development in the Atlantic
Long range model outlook
These are 51-realizations of the same model with different initial conditions. Each ensemble gets equal ~2% weight in a mean calculation.
ECMWF Ensembles | 10-Days Active Storm Tracks

A few ensembles on the Atlantic side of Central America = very low % (3%)
Day 13 | Active Systems
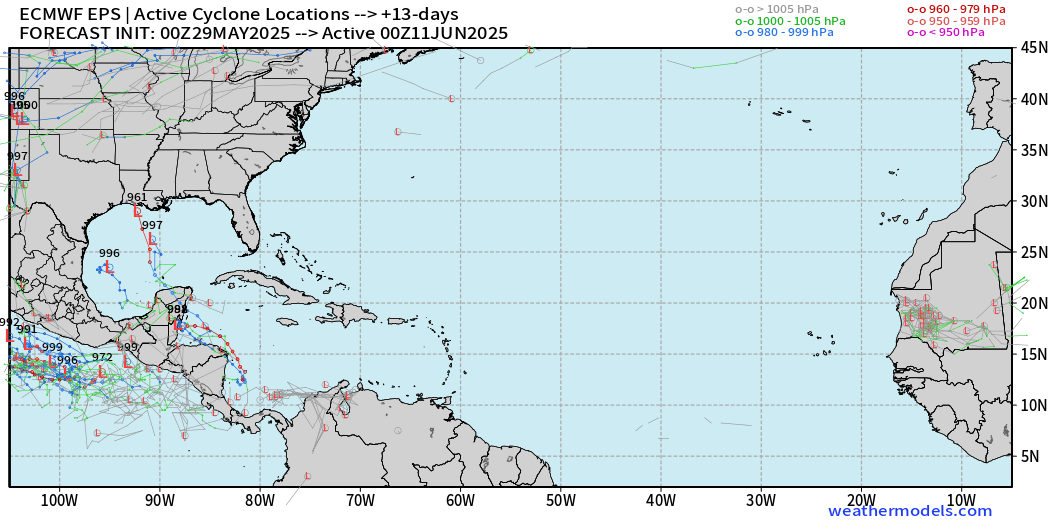
Again, low chance (10%) of a system in the Caribbean or Gulf, but if something can develop, no problem becoming a hurricane.
Day 15 | Active Systems

A few more active tracks at Day 15. Out of 51-ensembles, we’re still < 20%, which is in line with typical June activity in the Atlantic just picking a random year.
NOTHING imminent for the next 7-days as confirmed by NHC Tropical Outlook
Eastern Pacific Tropical Update
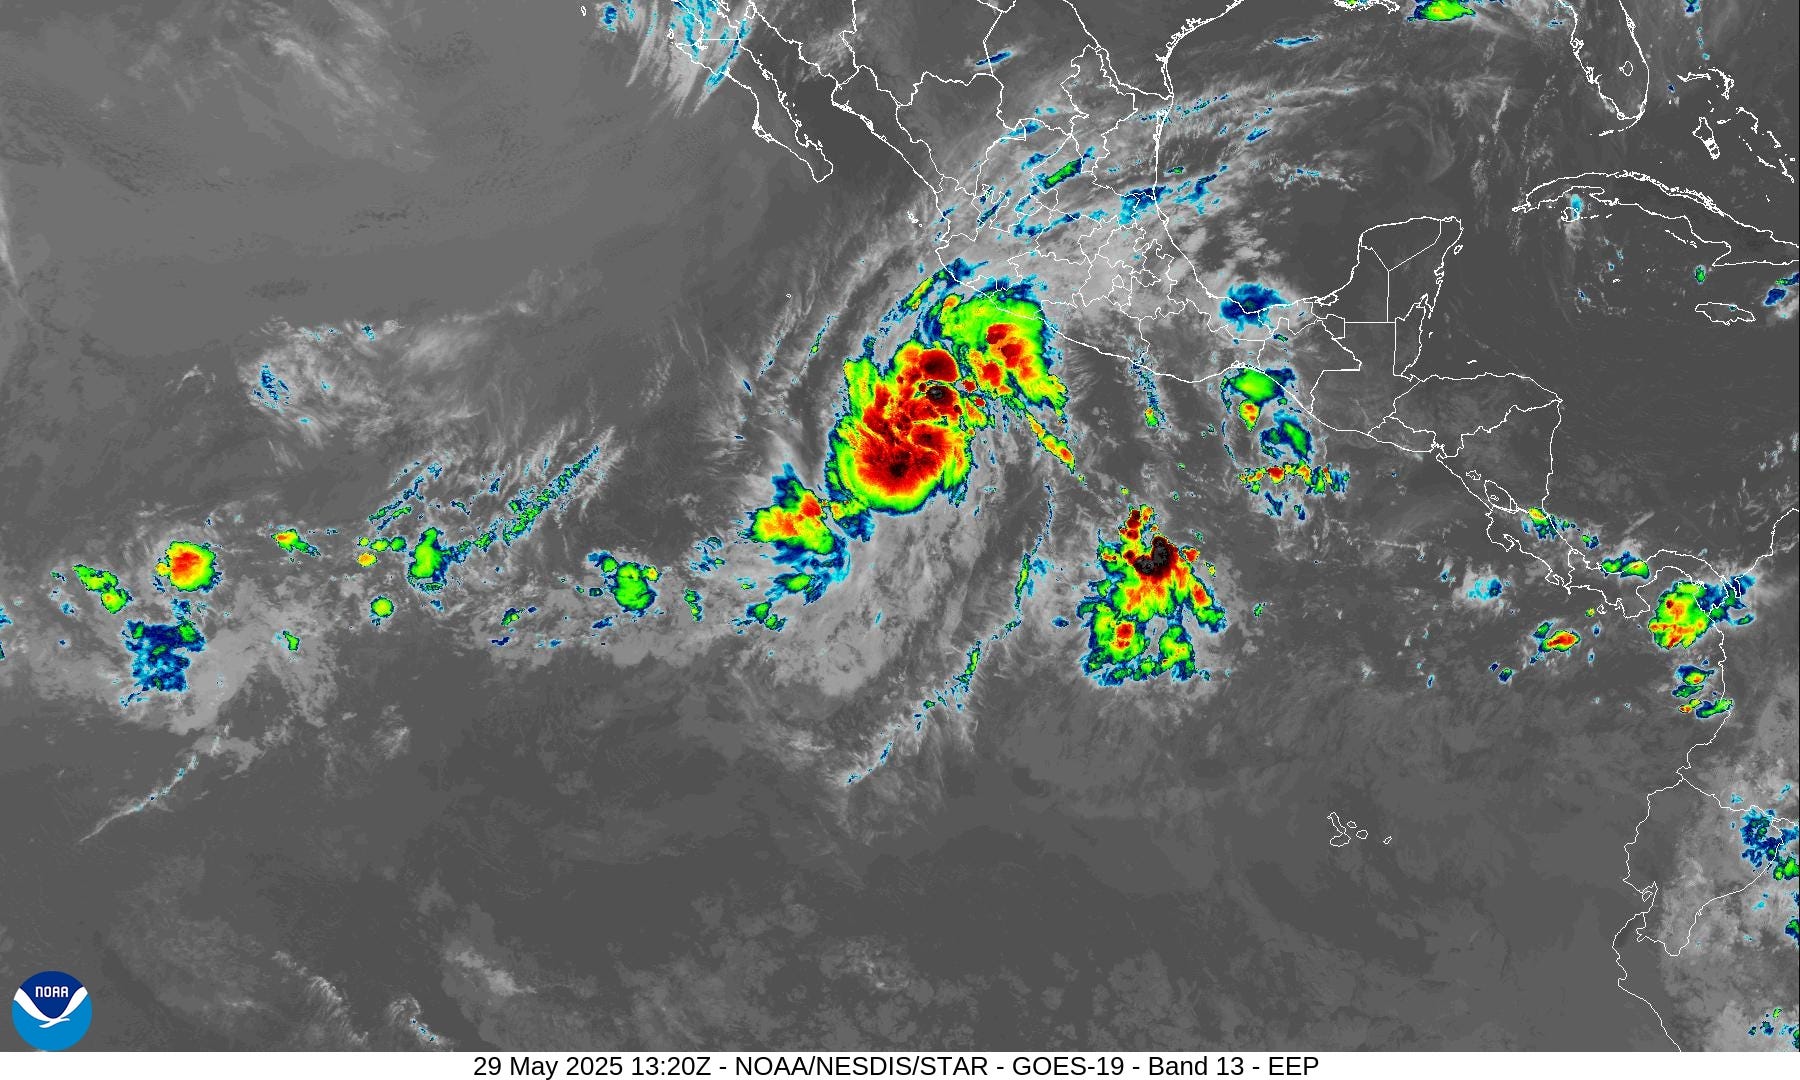
Tropical Depression 01E looks healthy this morning and should be upgraded to Alvin soon.
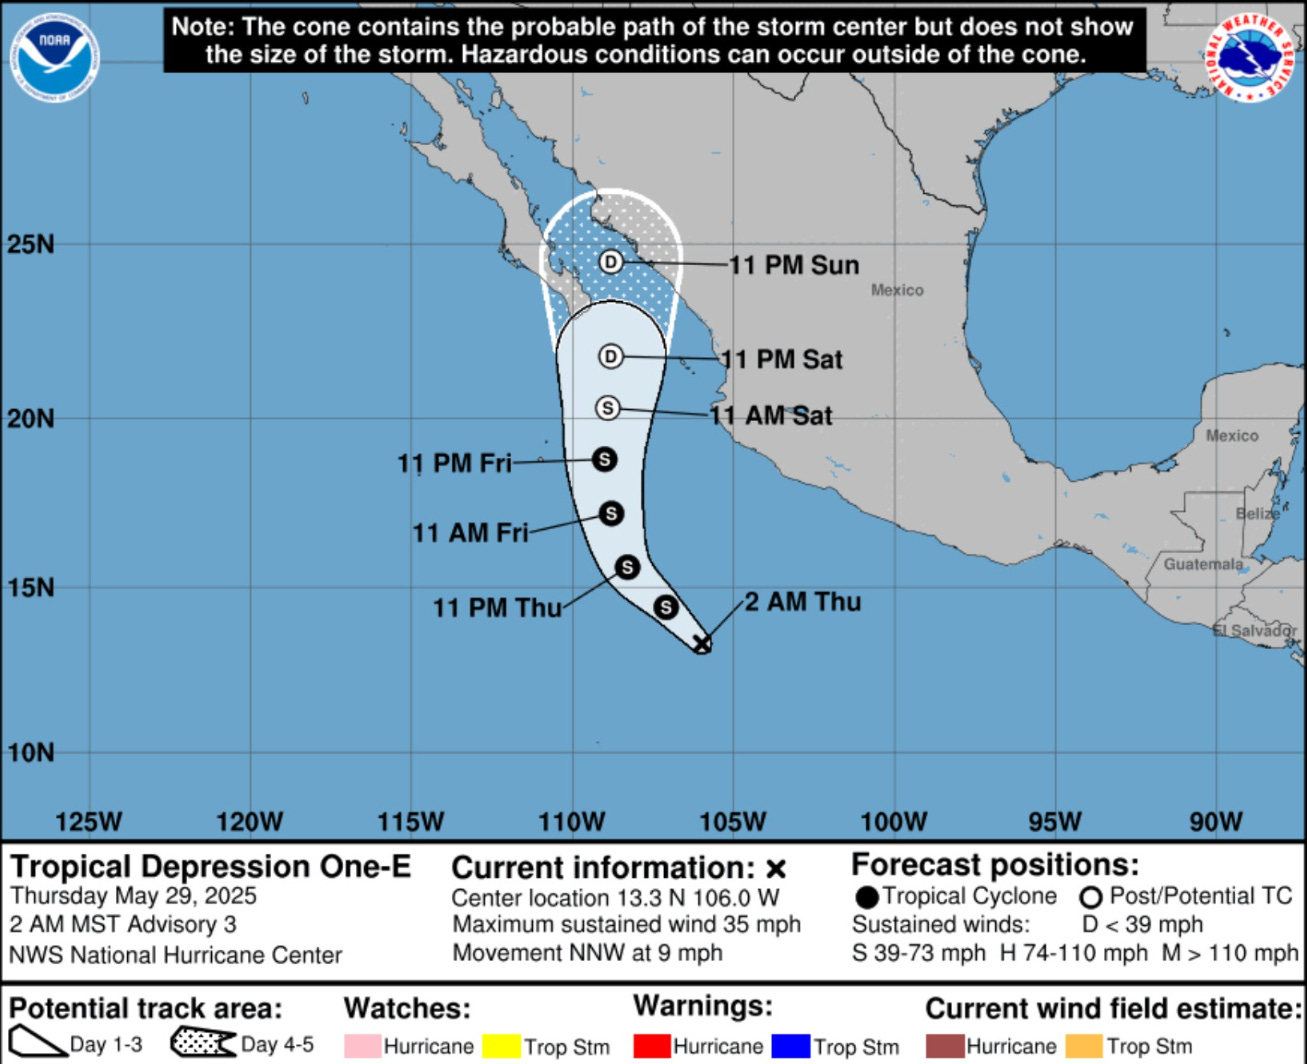
Maximum intensity of 50-knots is a tropical storm.
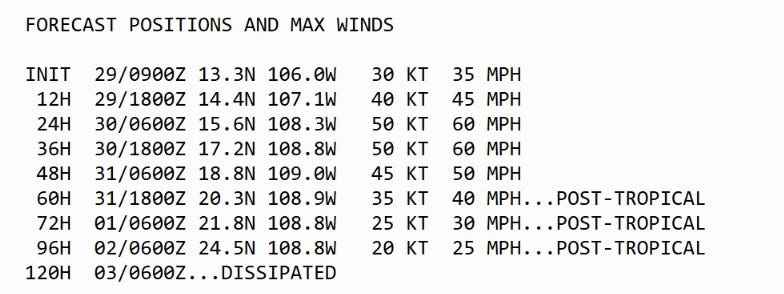
Ensemble minimum pressure of 990s could become closer to a hurricane … not too surprising considering the very warm water.

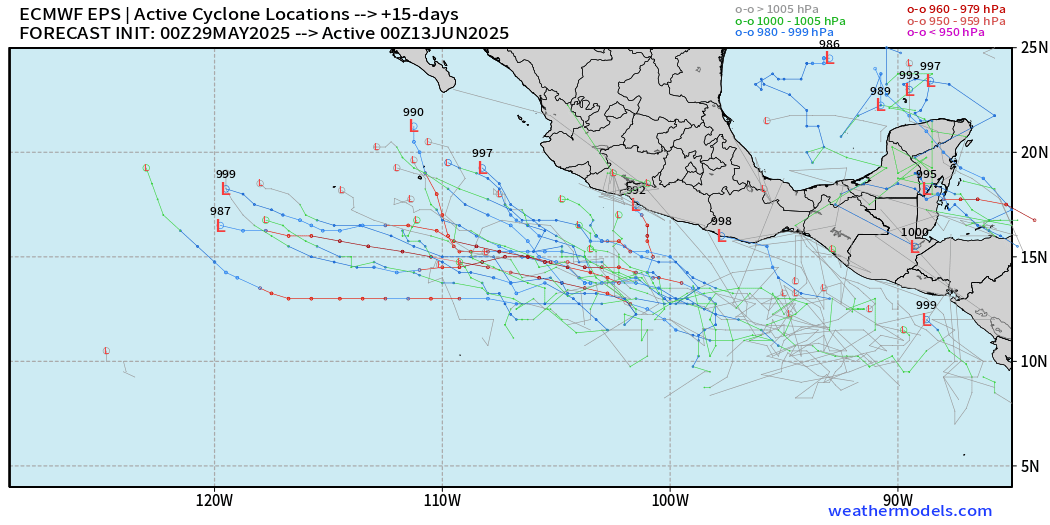
After ALVIN we don’t see much of anything until 10-days when the next system spins out of the ITCZ / monsoon trough south of Mexico.
ECMWF 00z Ensembles | Eastern Pacific
Day 7.5 active storm tracks
This would be the next system after Alvin … quite a few options spread out over 15 degrees of longitude.

Day 12 — these systems track due westward

Day 15
The ensemble tracks that become hurricanes continue onward.
Western Pacific Tropical Update

NOTHING at 7-days
One lonely typhoon in the 51-ensemble tracks through Day 10

SSTs are very WARM > 30°C east of the Philippines but the entire basin can’t be bothered to spin up a tropical system.

Maps sourced from weathermodels.com designed and innovated by yours truly! Please subscribe there for real-time access to the newest maps, charts from all of the weather models including ECMWF.
I love seeing the different weather patterns, specifically dust, coming off of Africa, towards the tropics & US. Do you think all the rainwear having is at least partially as a result of the Hunga Tobga Hunga and LA Nina?