


March 5, 2024 Spring Summer Outlook
Busy Atlantic hurricane season in ECMWF modeling

Weather Trader Update | Tuesday
ECMWF runs a 7-month forecast at the beginning of the month. This cycle extends from March through the end of September
The July SST shows La Niña building in the eastern tropical Pacific with the Niño 3.4 below 0°C anomaly by July 1st. The tropical Atlantic remains warm at 0.5° to 1°C above the 1993-2016 model climatology.
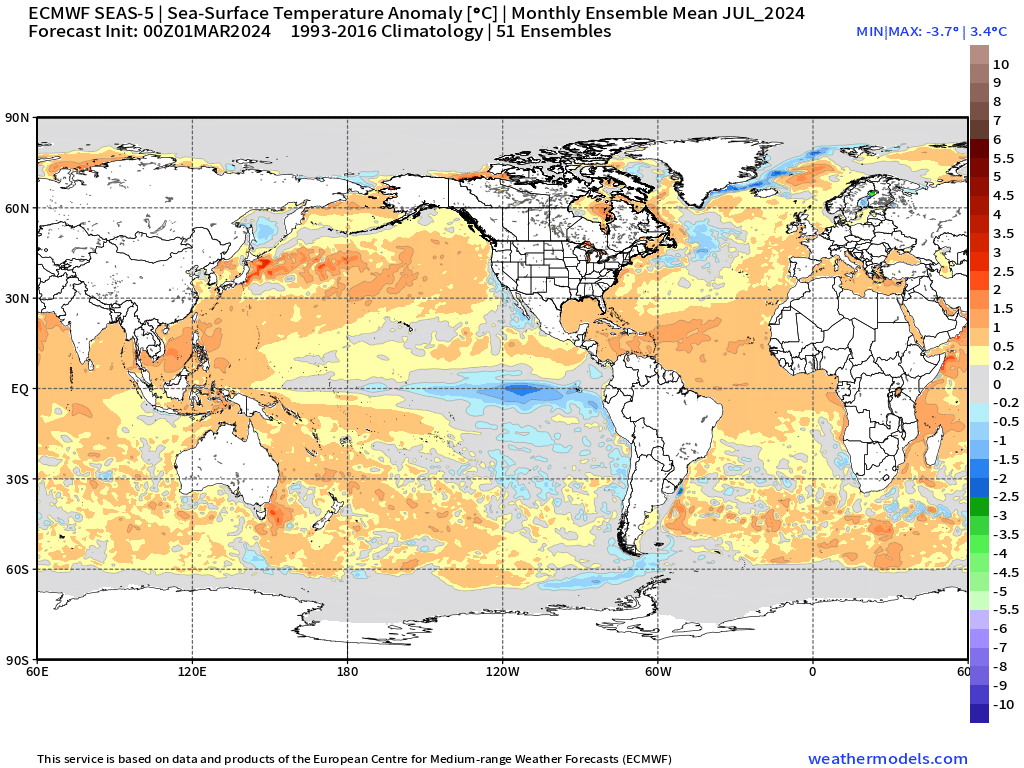
The Niño plumes show a remarkable transition to negative anomaly in the next 2-3 months with a median of about -0.5°C by September, which might not be the strongest La Niña at this juncture, but the “Spring barrier” makes ENSO prediction quite difficult until May. However, after an Super El Niño, the warm pool must recharge, and the basin flips to the “cool state” in the following summer. This will dramatically lower global temperatures just by the fact the tropics will lose the gigantic positive anomaly as fast as it gained it last summer.

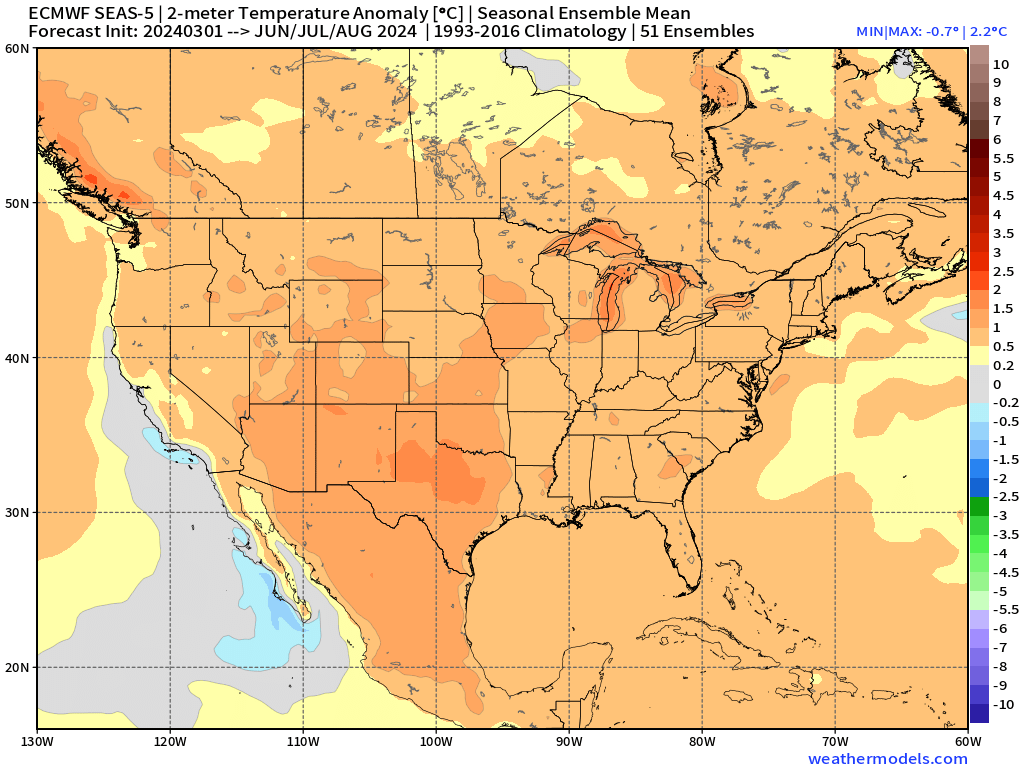
For the Lower 48, in terms of Summer temperatures, it looks like “above normal” from coast to coast. However, this does not say much about “heat waves” or how many 90°F days, but we could get that information from the model ensembles.
June-July-August 2024 Temperature Anomaly
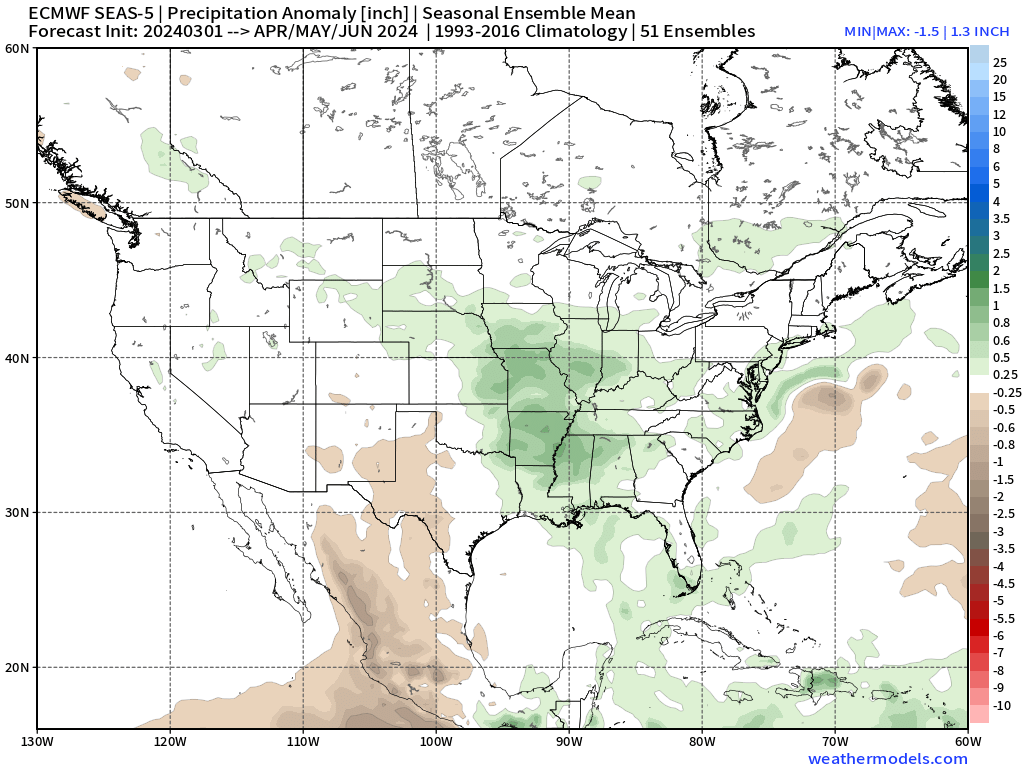
The April-May-June 2024 Precipitation Anomaly thankfully shows enhanced precipitation over the Mississippi Valley into the Corn Belt. Hopefully, there is no hint of drought after this recent warm period. Obviously no longer any rainfall deficits along the Gulf Coast or Southeast.
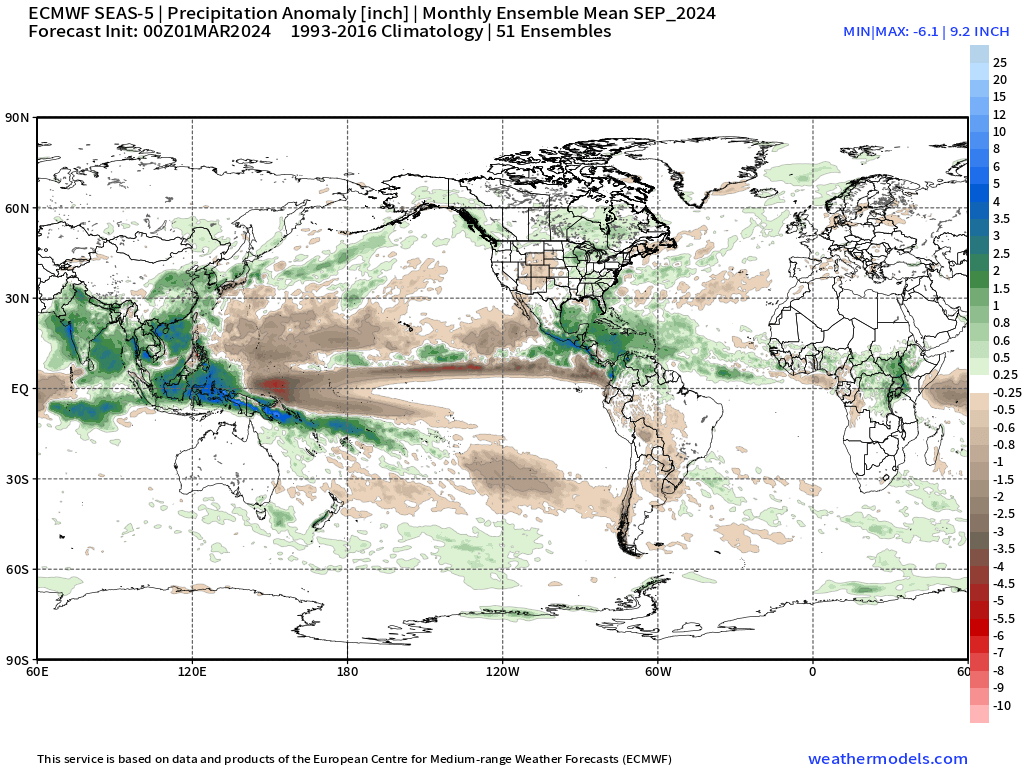
Hurricane Season September 2024 Precipitation Anomaly
The largest and most significant positive precipitation anomalies are over the Philippines and the Gulf of Mexico.
This makes sense in the Western Pacific during La Niña as typhoon genesis and tracks are shifted westward e.g. well away from Guam.
However, in the Atlantic basin, this considerable rainfall signal in the Gulf of Mexico and Caribbean usually means tropical storm activity.
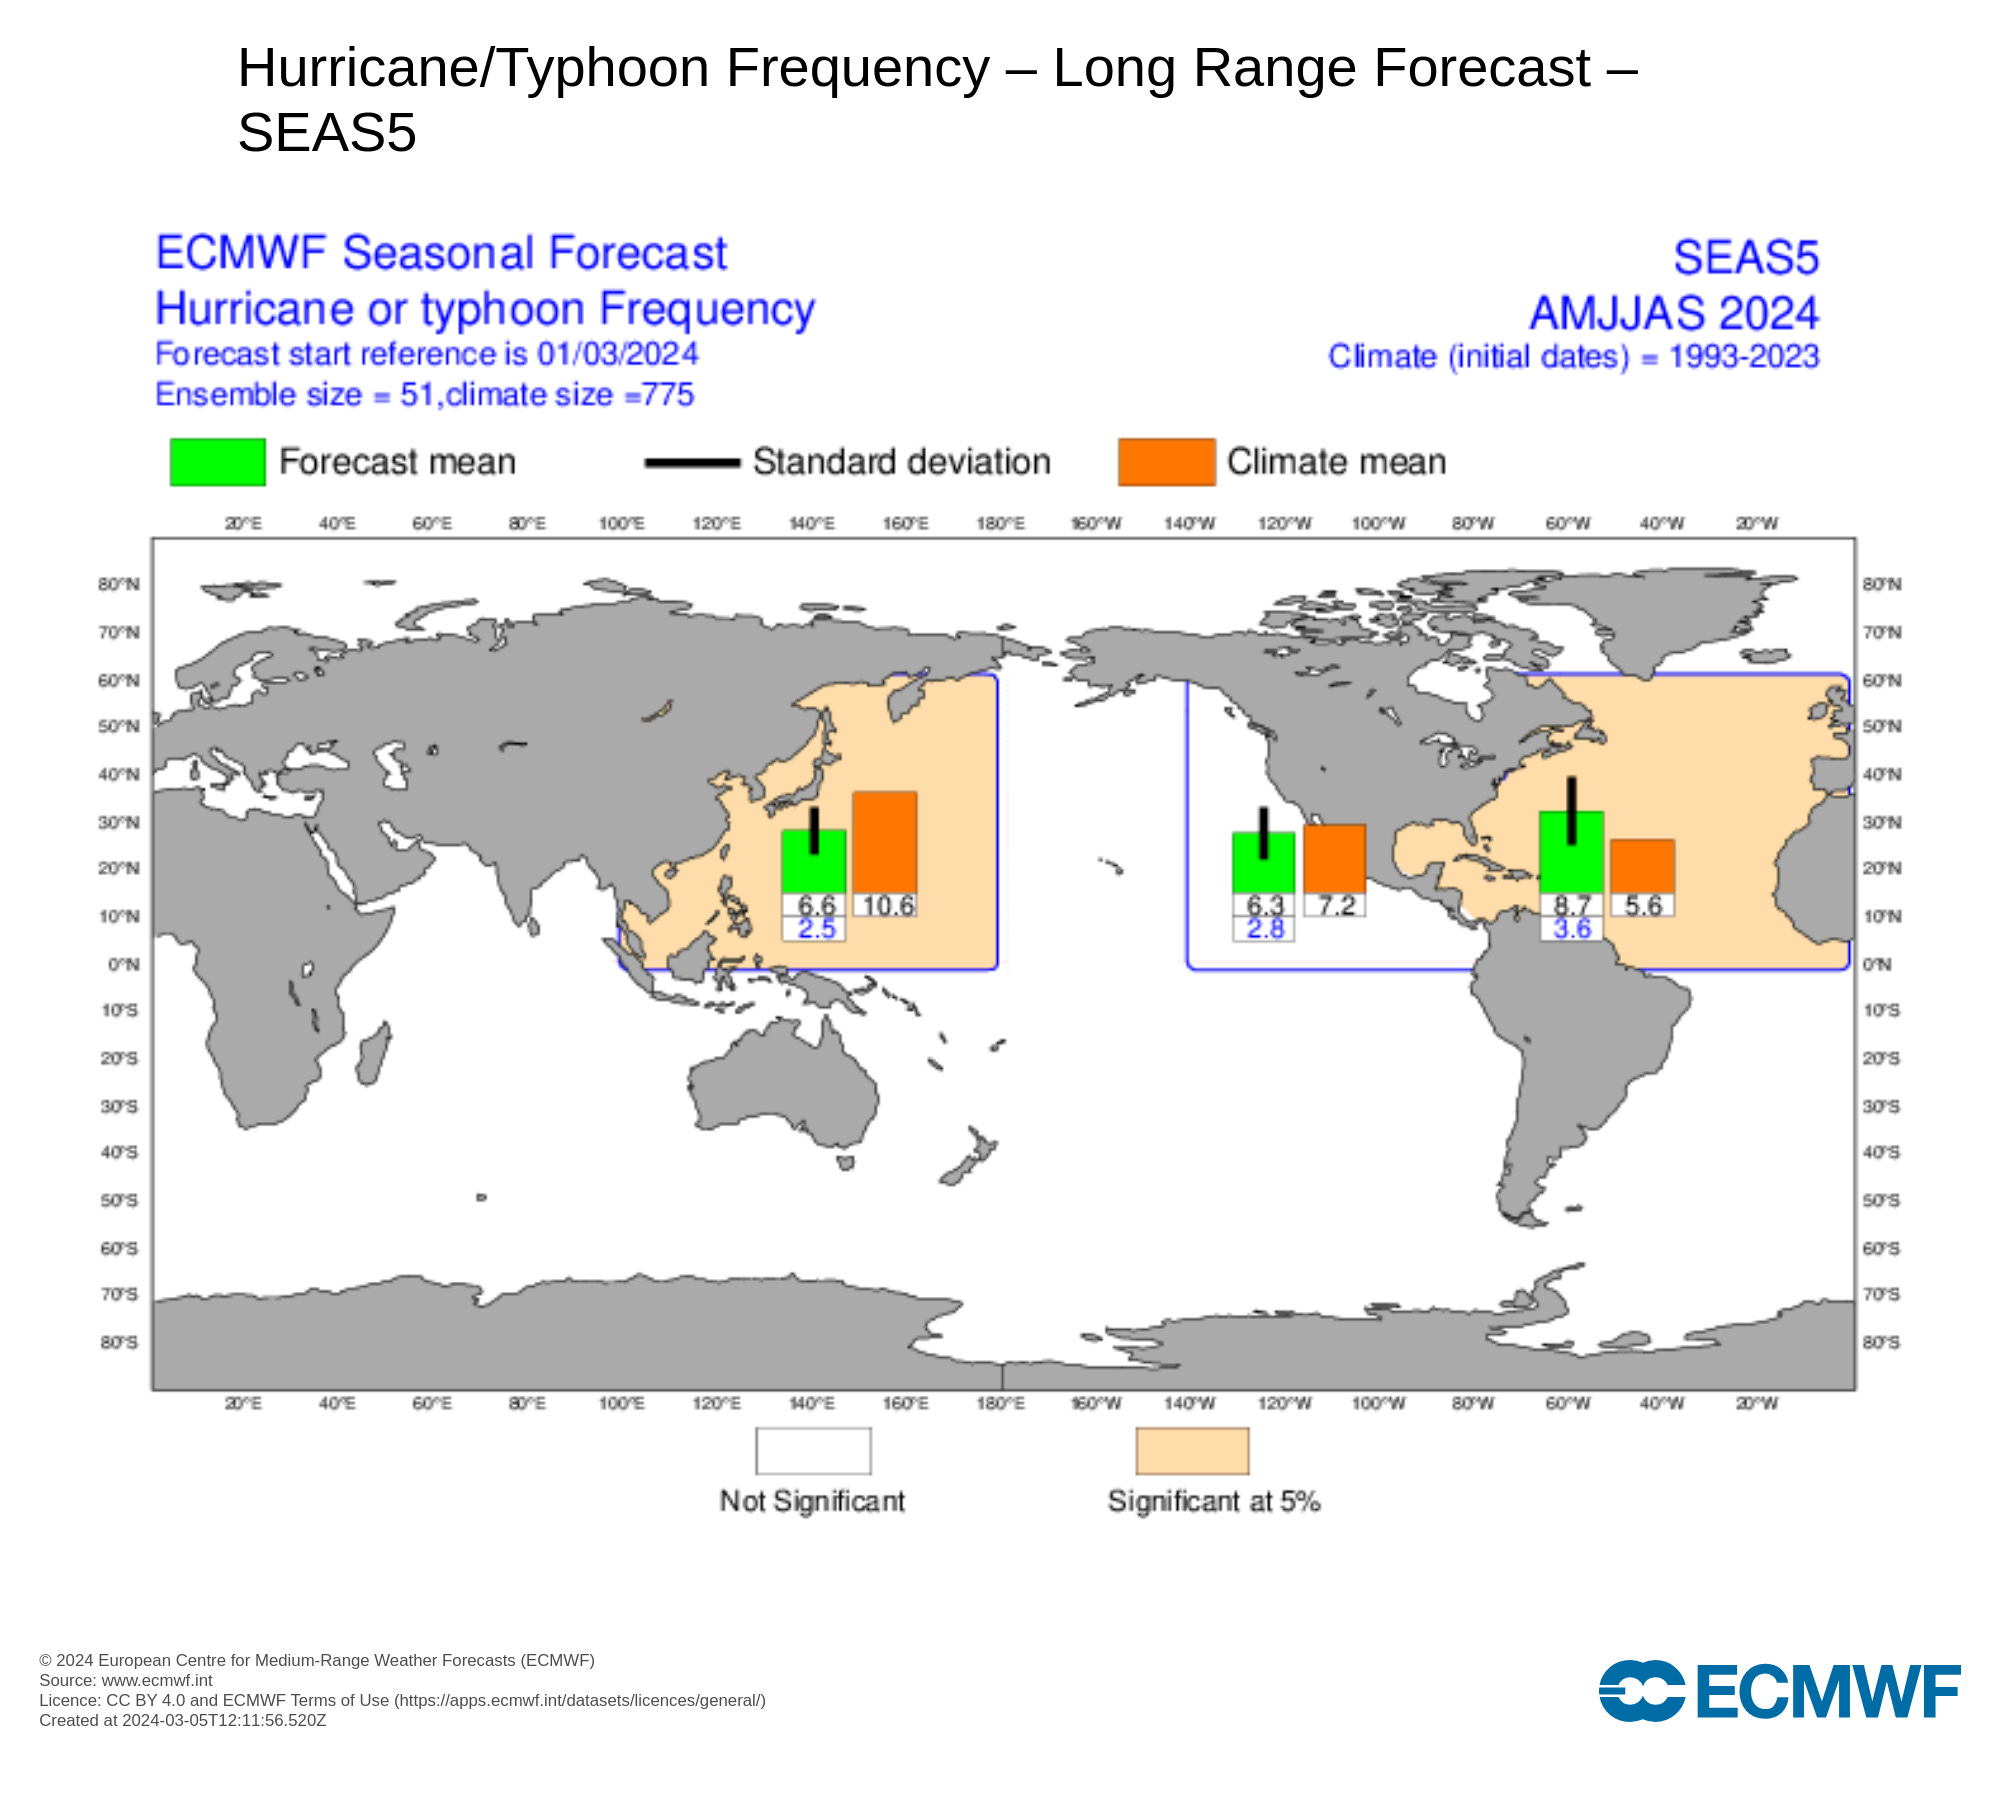
The Accumulated Cyclone Energy (ACE) forecast for April - September misses out on October, which is about 1/3 of the Atlantic total, but since a busy season will likely remain busy, we can extrapolate based upon the April-Sept totals for the entire season.
And, 1.7x normal in the Atlantic vs. 0.5x normal in the Western Pacific. This is typical La Niña. 1.7x normal is the mean of the ensembles, so it could be higher by a standard deviation — or lower.

This ACE is created out of 17.4 named tropical storms vs. the model climate mean of 11.7.

And, 8.7 Hurricanes vs. 5.6 normal or the model hindcast mean.
6.6 Typhoons vs. 10.6 in the Western Pacific would be a quiet season.
Also, this does not include October — November, so additional storms & hurricanes would need to be added. In the April forecast, we will get an updated number of storms.
Wednesday High Temperatures | March 6, 2024
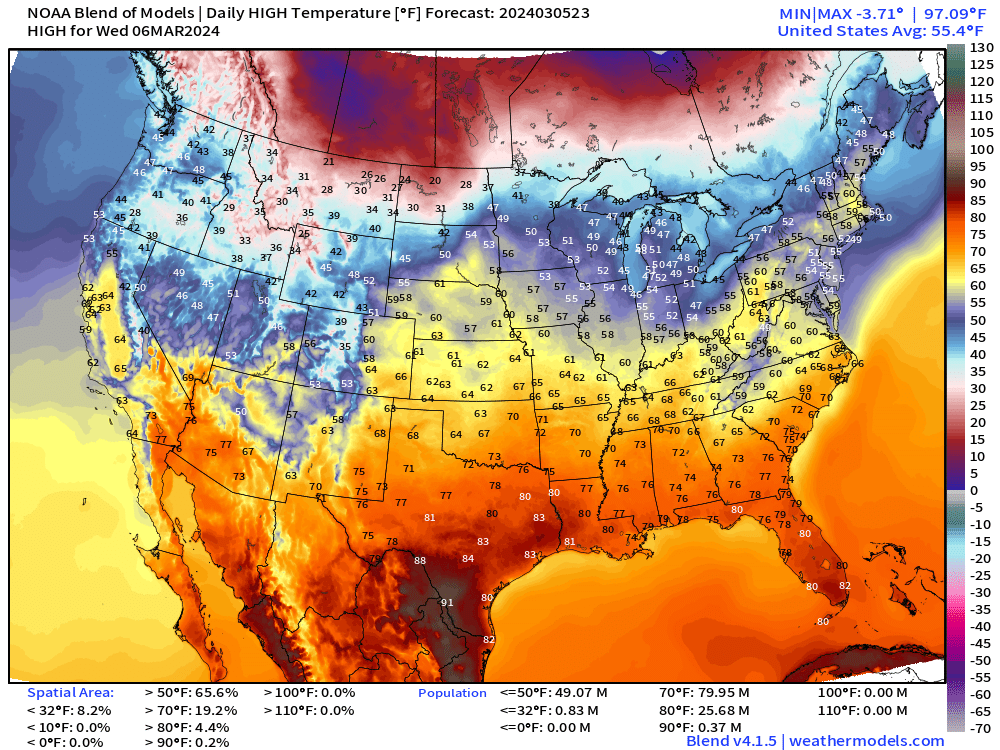
New England finally warms up in the 60s — but it’s going to be soggy into Thursday.
70s warming up about 80 million Americans on Wednesday.
Next 8-Days Weather | ECMWF 12z HRES

Storm #1 will drench the Northeast into Thursday.
And, now back to watching this area of Low Pressure that will spin over the Northeast Sunday into Monday. The snowfall map from ECMWF HRES shows significant inland New England snowfall, but only 1-inch or so along the coast. Will dig into this more tomorrow morning.

7-Day NWS WPC Rainfall

This is an enormous amount of rainfall for 7-days east of the Mississippi. From 2 more storms.
Yellow is 1-inch+ of rainfall so that covers every state east of the Mississippi through 7-days.
Red is 2-4” with locally more up to 6-7” around Atlanta. Yikes!
Thank you to Subscribers and Supporters! Welcome to March 2024 — so much is going on in the world of weather! Please come along for the ride!