


Heat dome to bake Pacific Northwest
Early season tropical wave shows potential for storm development
Over the past few days, meteorologists looked on in wonder as the weather models we use everyday (GFS, ECMWF) kept showing unbelievably high temperature forecasts for the Pacific Northwest including Portland and Seattle. There is a good chance that Portland will crush its city record of 107°F with a forecast of 111°F on Sunday. Seattle will go over 100°F.

Middle atmosphere ridge or heat dome
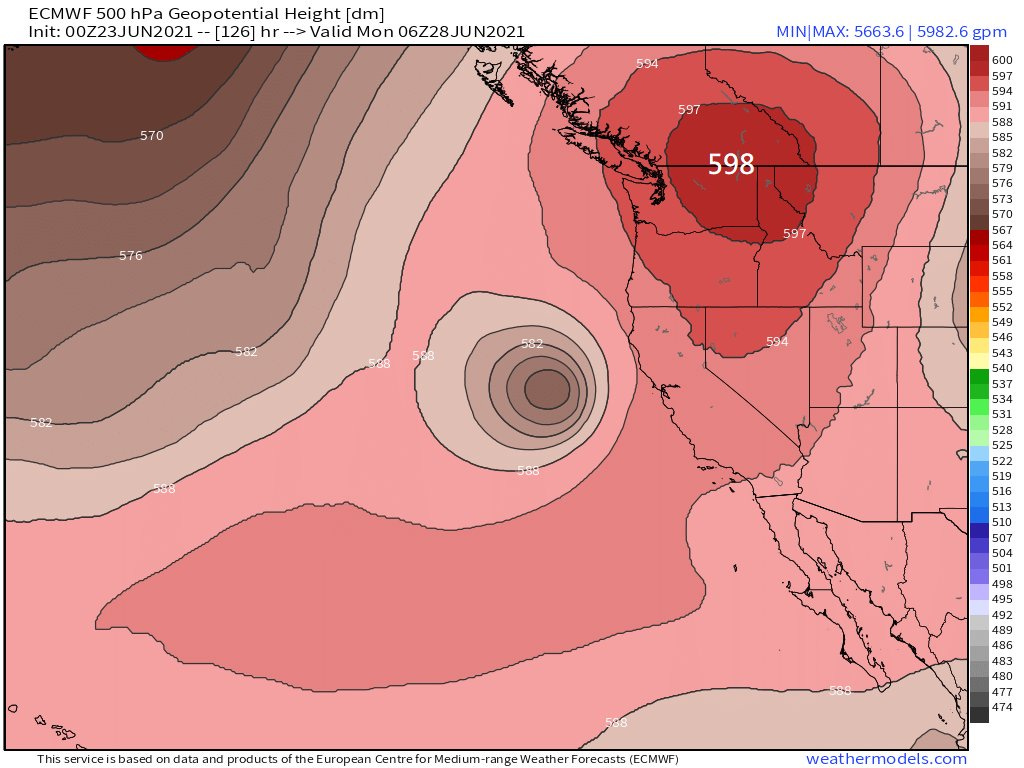
The primary cause of the extreme heat is the development of a ridge of high pressure in the middle-atmosphere that favors descending and drying air. The offshore flow around the “heat dome” is clockwise meaning easterly winds will funnel through the Columbia River valley and bake Portland in the process.
The location of this intense heat dome is unique historically (since 1979) for its center along the Washington/British Columbia border. The height of the 500 hectopascal pressure level is used to determine the strength of the ridge. 5983 meters is considered extremely high, and near the maximum observed on Earth since we have been measuring. The flow around the “heat dome” is clockwise or anti-cyclonic. That little brown feature off the California coast is a cut-off cyclone that is spinning counter-clockwise. So, between the the low and heat dome, the flow will be offshore in Oregon and Washington this weekend. That is the recipe for extreme heating.
Historical Context for Heat Dome
Of course these heat domes have happened before as they are a normal part of the atmosphere in the middle-latitudes. The jet stream undergoes an undulation and buckling process creating the (Rex) blocking ridge shaped like the Greek letter Omega.

How does this block form? It is the consequence of tropical convection upstream or heavy rain and storms in the Western Pacific. The energy is dispersed downstream and causes the wave pattern and jet stream to undergo large excursions north and south. Since the Earth is rotating sphere, the Coriolis force along with conservation properties (potential vorticity) creates various cut-off lows, ridges and zonal patterns around the world. This is a constant process. Our ability to accurately forecast the weather at 5 or 7 days requires us to precisely model these features — putting them in the right spot at the right time. This “heat dome” will have been “sniffed out” by the models at least 7-days ahead of time.
Other storms like Nor’easters, hurricanes, and typhoons can really excite the jet stream and cause all sorts of extreme weather thousands of miles away. It’s all connected, of course.
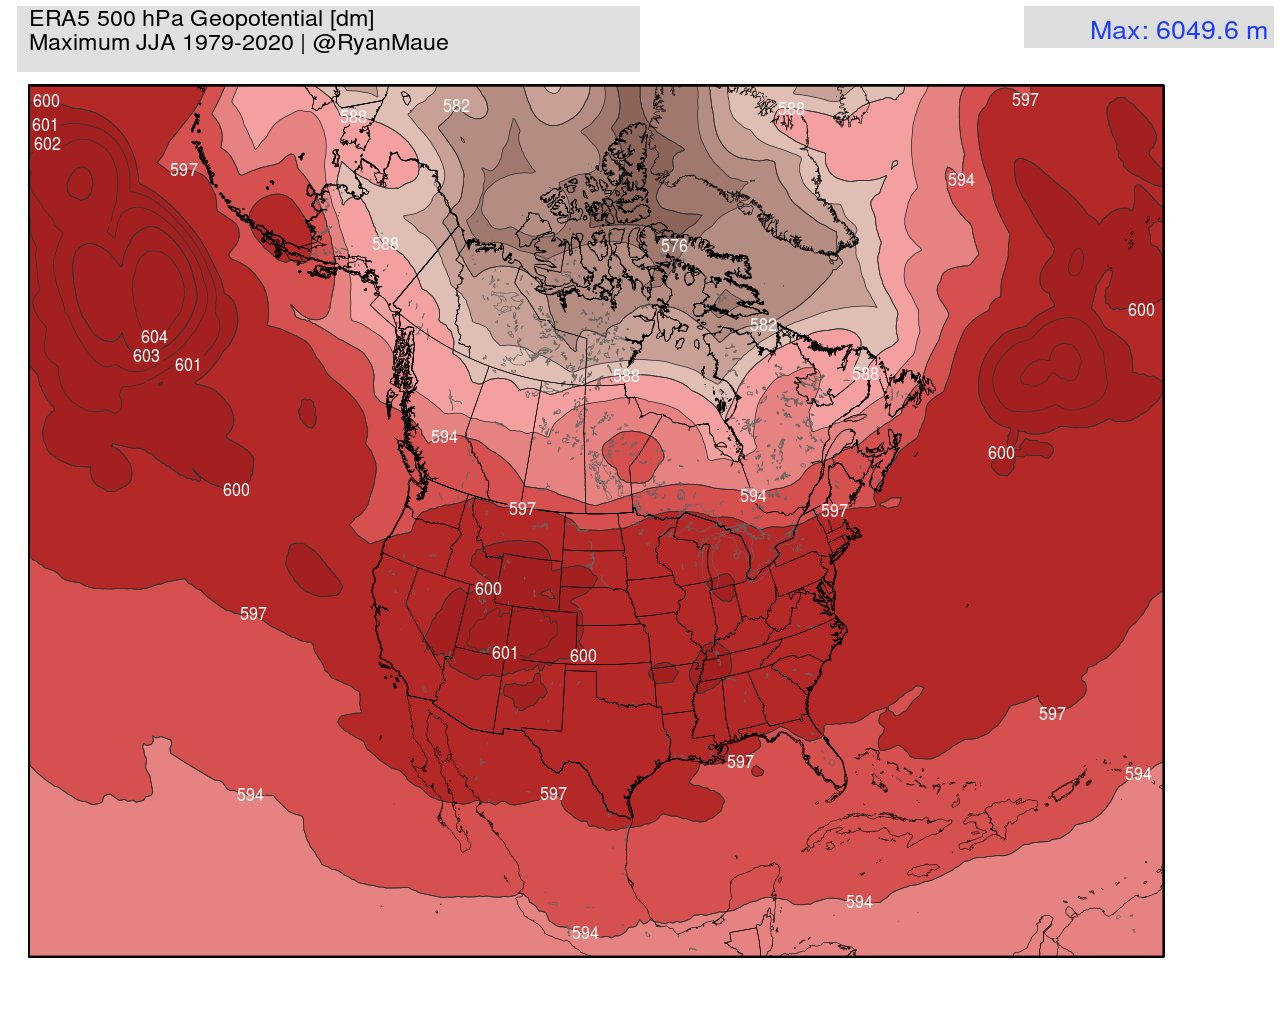
Using historical data, we can compare the last 40-years (or 70+ if you prefer) of weather model output to upcoming forecasts. What is the highest possible 500 hectopascal height at every location and will the weekend forecast heat dome exceed that?
The general answer is yes. The location of the heat dome in northern Washington at 5983 meters (598 decameters) would be about 40-meters higher than previously seen. However, the more intense heat domes have been found elsewhere > 6000 meters. Climate change is generally creating more 6000-meter “heat domes” and you can find a bunch of examples in various media outlets over the years that I contributed data analysis and quotes.
I posted a few more threads on Twitter @RyanMaue. I realize that this probably makes little sense to the non-meteorologist, but the jargon should be familiar if you are a weather hobbyist. Heat dome, polar vortex, bomb cyclone are all technical terms we use in meteorology that have been popularized into mainstream culture through social media.
Early Season Tropical Wave development
Now this was surprising to see Wednesday afternoon with the 12z ECMWF EPS update. An area of low pressure off the coast of Africa at around 10°N latitude develops into a tropical storm — holds together across the entire Atlantic — and then blows up into a powerful hurricane. This is not a typical place to look for tropical storms in late-June, but 2021 may throw out the rule book.
These spaghetti tracks are just scenarios from a pool of 51 different model solutions. But, it’s painfully apparent that this model is bullish on a named storm.
Nothing is imminent — but we must keep a very close eye on this area over the next few days. Why? The water is very warm at low latitude. And, vertical wind shear is very low for late-June. Some Saharan dust is always a factor, but it does not look to be a major inhibitor.
Many things need to go right in order to get a tropical storm and one negative ingredient can throw a wrench in the whole process.
