Wednesday Morning Update | Hello to new subscribers!
2024 Atlantic Hurricane Season
With the anticipated shift to La Niña, there is already a flurry of media warning about the upcoming Atlantic Hurricane Season especially with the record-warm Sea Surface Temperatures [SST] in the North Atlantic.
First the SST anomaly (deviation from 1991-2020 average) shows blood red over the eastern Atlantic similar to early 2023. While research has not been published yet on the proximate cause of that anomalous eastern Atlantic warmth, a prevailing hypothesis is that the multi-year La Niña favors atmospheric circulation patterns in the middle-latitudes — ridging and where/how the winds flow over the basin — lead to less mixing, cloud-cover and therefore increased surface temperatures.
Whatever the reason, this recent El Niño was not necessarily very strong in terms of atmospheric circulation phase locking as opposed to the very high Nino 3.4 values. Instead, using the Multivariate ENSO Index v2 (MEIv2), we see that the red bars only exceeded 1.0 for a brief period — a far cry from 2015-16 and 1997. That seems to be a change w/larger El Niños in the 1980s and 1990s in terms of atmospheric circulation.
The MEI, which combines both oceanic and atmospheric variables, facilitates in a single index an assessment of ENSO. It especially gives real-time indications of ENSO intensity, and through historical analysis - provides a context for meaningful comparative study of evolving conditions.
What this boils down to: the Pacific tropics = very warm, but the teleconnection to the Atlantic is NOT being felt as strongly in terms of vertical wind shear and the configuration of upper-level waves. Thus, and this is expected, another dip into La Niña territory on top of the already previously induced La Niña warmth = compounding the SST anomaly upwards.
Looking ahead to September 2024 SST anomaly over the globe: we see the tropical Pacific below normal with strong La Niña underway, but the warmth in the Atlantic continues. This would ordinarily mean “all systems go” for a very active hurricane season typical of previous similar oceanic states.
However, we must remind ourselves that “anomalies don’t do anything” and it’s the actual ocean temperatures and atmosphere that must work together to produce a tropical storm. That means overcoming the barriers or negative influences that typically inhabit the deep Atlantic tropics in the so-called Main Development Region [MDR] east of the Caribbean to the coast of Africa:
African dust and Saharan Air Layers: those can put a lid on genesis or limit intensification with dry air limiting convection and instability
Vertical wind shear with passing upper-tropospheric troughs (TUTTs) can tear a system apart that’s trying to grow
Large scale unfavorable conditions with intra-seasonal fluctuations in the tropics e.g. Kelvin waves, MJO.
The 2023 Hurricane Season was more active in terms of “named storms” but not particularly so with the intensity of hurricanes in the deep tropics. Instead, almost all of the action was in the open Atlantic — recurving out to sea. The tropical waves over Africa that emerged into the Atlantic were quite robust. The one notable exception was Hurricane Idalia that made landfall as a Category 3 in the Florida Big Bend.
Verdict: 2024 should be busy based upon the growing La Niña, warm SSTs, and continuation of recent 30-year “active period” in the North Atlantic.
What does busy mean? I think it would be “extreme active” at this juncture, and this is according to NOAA’s definition.
Extremely active season: An ACE index above 159.6 x 10⁴ kt2 (corresponding to 165% of the 1951-2020 median).
Above-normal season: An ACE index above 126.1 x 10⁴ kt2 (corresponding to the 67th percentile of the ACE values from 1951-2020).
That doesn’t say much about the number of hurricanes or major hurricanes or landfalls. However, with an ACE in the 160+ range, that means more like 3 to 5+ MH, with long-lived basin crossers at high intensity including Category 5. In 2023, the tracks had a considerable northerly component due to the upper-level steering currents. That may not be the case in summer/autumn 2024 with the transition to La Niña.
I’ll continue to provide updates on the upcoming 2024 Hurricane Season!
Low Pressure into Ohio Valley later on Thursday
Quiet weather continues across much of the Lower 48 especially east of the Rockies for the rest of February as winter goes into full retreat — and a massive warmup is on top. An area of thunderstorms could develop in the Ohio Valley with an area of low pressure tracking quickly off the East Coast later on Friday. Some light snow is possible for northern New England, otherwise rain.
Extreme warmth across the Central and Eastern U.S. builds into early next week before a cool down. 60s and 70s surge into the Midwest by next Monday. Ever warmer in Texas, pushing 90s. And, 70s and 80s in the Southeast. I feel that winter has been long enough, so this “spring fever” is just fine with me.
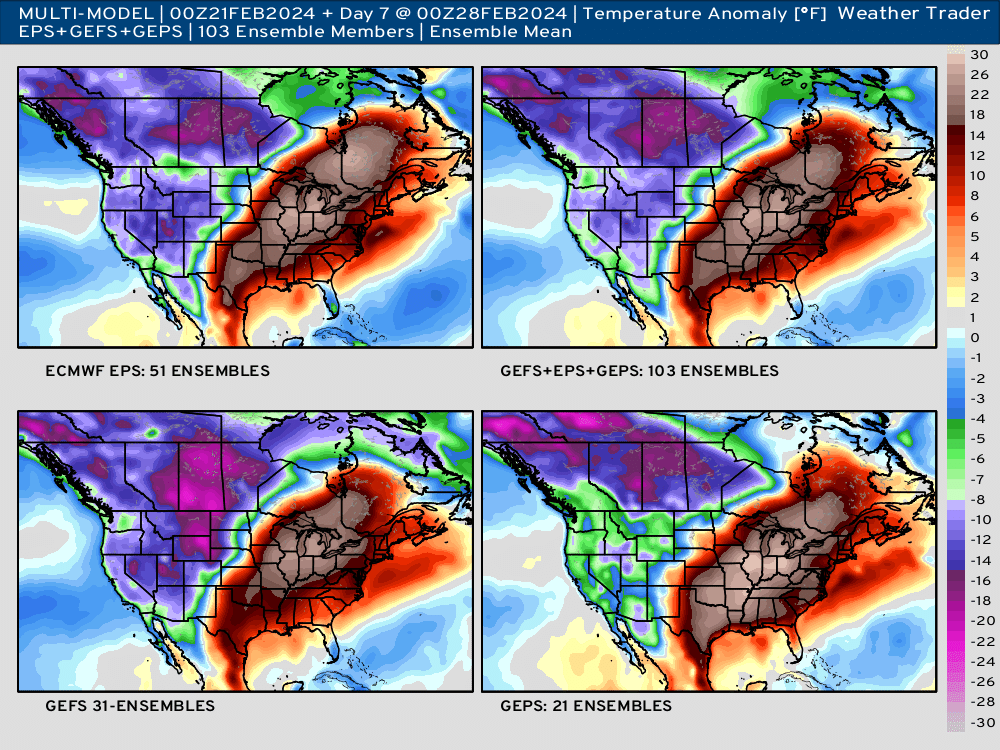
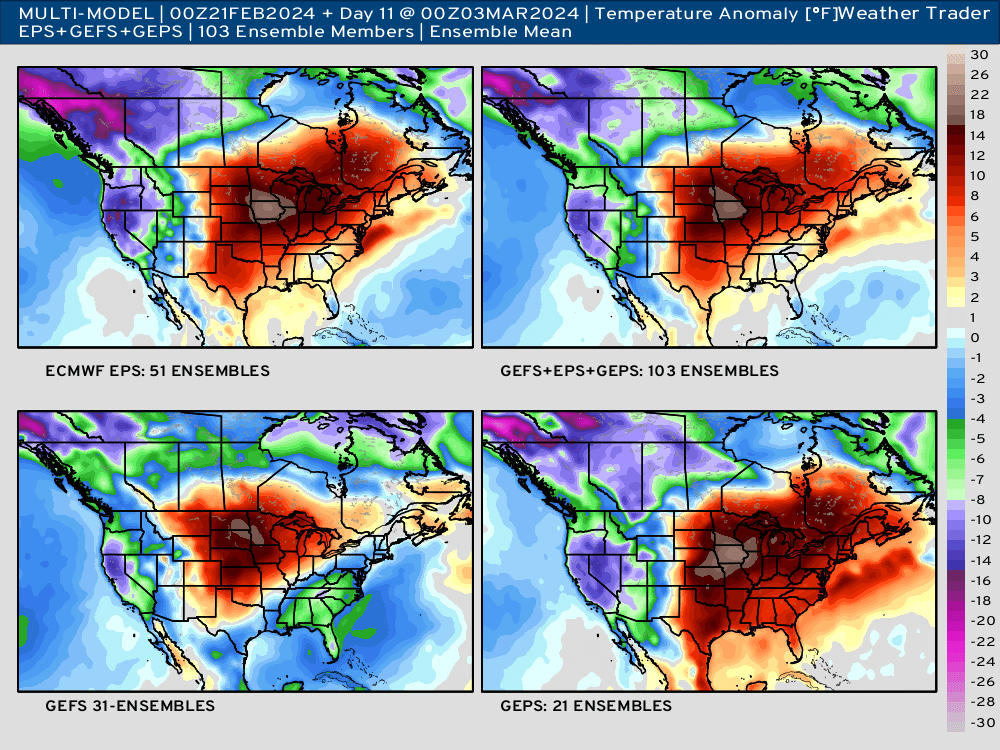
Very Warm Pattern into March across Eastern US
Looking at the Multi-Model ensembles at Day 7 (Feb 28th), all are confident in major way above normal temperatures east of the Rockies. However, there is Arctic air lurking in Alaska and Canada. Where does that go? The cold air does make it to the Rockies
However, zooming ahead to Day 11 (March 3) the cold air is still bottled up over the Western U.S. with a return to warmth and strong ridging east of the Rockies.
More Ensemble Clustering Tools at Weather Trader
WPC 7-Day Precipitation Totals
Now looking at more significant rainfall over the Ohio River Valley: 1 to 3”
The heaviest rain / snow now focused on the Pacific Northwest through Day 7.
10-Day ECMWF EPS Median Snowfall
No update from yesterday: Still not seeing a major winter storm east of the Rockies. Some lighter snowfall accumulations in the 1-3 inch rain through 10-days is nothing to get excited about. Plus, it will not be happening in the next 7-days, so we are looking into Week 2 and that’s the first week of March, if at all.
If you want a LOT of snow, then fly out West to any mountain.
(Maps from weathermodels.com and weathertrader.com)
Thank you to my paying subscribers! Consider upgrading to a Yearly Plan if you find these updates valuable and wish to support my development at Weather Trader. As you can see, your support has paid dividends with considerable progress made to launching Weather Trader at full-tilt. There is still some work to do in the coming days/weeks. Also, it allows me to provide (usually) interesting and valuable commentary on scientific topics on X. Feel free to say hello and follow on X/Twitter (@RyanMaue)


Ryan, I wish you would use your contacts with NOAA/NWS to advocate for the addition of a category system numbering for the major atmospheric rivers that bedevil us out here on the West Coast. We don't see all that many hurricanes but the atmospheric rivers are getting stronger and causing more damage of late.