


February 19, 2024 Monday Update
Spring fever on the way
Monday afternoon update

Quick announcement: Forecast Farm will debut under another Newsletter with this Weather Trader Substack publication. You’ll automatically be signed up. I understand that you may not be a farmer yourself, but the weather and climate related content will probably be quite interesting. This is the culmination of about 6-weeks of development supported by my Substack subscribers who deserve incredible thanks for allowing this idea to come to fruition.

Here’s a good example of crop-weighted rainfall from GFS through 15-days. We go county-by-county and determine the total rainfall and then weight it by historical corn production in millions/billions of bushels. You get one number for the U.S. which can be compared to climatology. We will use ensemble clusters and the best conventional and A.I. models to provide weather forecasts for the next 1 to 90 days+ including seasonal modeling (ECMWF SEAS5 and NOAA CFS).
Of course, for folks that do not have a farm but a lawn or garden outside, it’s just as important to keep track of the rainfall and temperatures through growing degree days (GDD) at every location. And, that’s what we’ll do for your farm, home, or greenhouse.

I want you to have the best possible weather forecast + climate information at your disposal so you will be able to grow the best grass, rutabagas, or pumpkins. I grew up reading and enjoying the Farmers’ Almanac, and my motivation is to follow a vintage approach. Also, I am using a common theme, as I’m sure you noticed, of U.S. Highway sign fonts and colors: signage green, rest area blue, and even National Parks brown is coming. I’m obsessed with road signs, maps, and love the colors, and demand MUTD compliance!
However, I will need your help to fund the computer servers necessary to process the enormous amounts of data for this operation. So, if you are a monthly subscriber, then I’m offering a discount to upgrade to annual, or a new subscriber for annual.
California Atmospheric River
The main active weather today is across the West Coast with an atmospheric river drenching Los Angeles and Southern California again.
This is a forecast radar animation from the RRFS-A North America (experimental model) processed at Weather Trader. I have coded up a few examples prior to going live on the website with multiple large scale domains including the entire Western U.S. into the Pacific. Normally the model cuts off just off California but this domain is enormous extending from Hawaii to Alaska and to Greenland and Puerto Rico. You’ll really enjoy viewing this model on a daily basis.
The severe weather in the Sacramento Valley has not panned out yet. However, I just noticed a severe cell in the valley SE of Fresno. Recent radar:
Another 2-inches of rainfall — maybe 3” in the mountains around Los Angeles. Flood watches have been posted for this ongoing atmospheric river event.

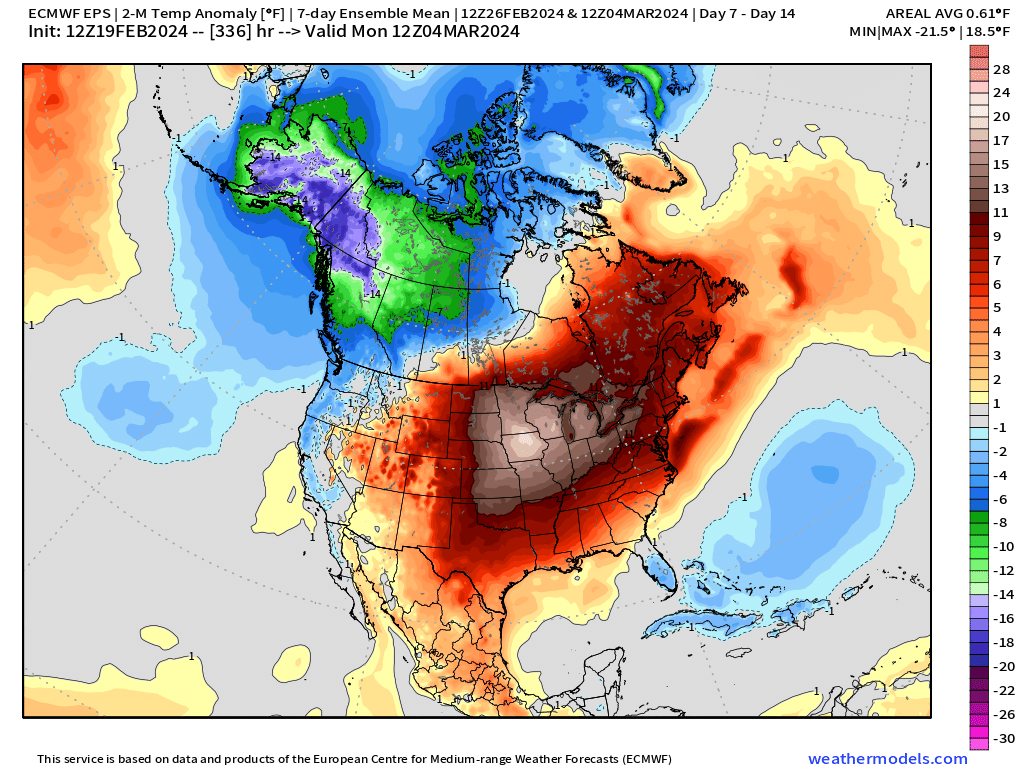
Very Warm Pattern into March across Lower 48
More Ensemble Clustering Tools at Weather Trader
New addition of Total Precipitation Anomaly (%) of normal from the EPS 12z clusters (3 and 4) Days 5, 7, 10, 14, 15.
Definitely need to watch precipitation and drought monitor heading into March as the lack of snowfall, and warmth always brings up 2012 into the minds of farmers.

Indeed, much above normal temperatures from the 3 ensemble systems (EPS, GEFS, GEPS) at Day 7 (February 26th).

Rather than posting too many maps and filling your email inbox, you can see these Clustering Tools freely at WeatherTrader.com: and continue to support these products (which will earn any subscriber to this Substack a golden ticket into the Weather Trader interface as founder/supporter, and friend of Ryan)
Week 2 February 26 - March 4, 2024
The warmth eventually erodes from West to East as the cold dome over Alaska shows signs of breaking off into the Lower 48. However, we’ve been fooled by that signal in the recent past, just to be hit with another “heat dome” ridge over Southern Canada and the U.S. Midwest.
Lower 48 Temperatures
Tuesday Highs | February 20, 2024

Lower 48 average high temperature is 54°F
Next Monday Highs | February 26, 2024

Just to zoom ahead to the warmth — Spring fever — on the way heading into next week east of the Rockies. Widespread 60s and 70s from the Plains to the Mid-Atlantic. Sadly, looks like New England stays a bit chilly, but not so bad to end February. 90s in the Rio Grande.
WPC 7-Day Precipitation Totals
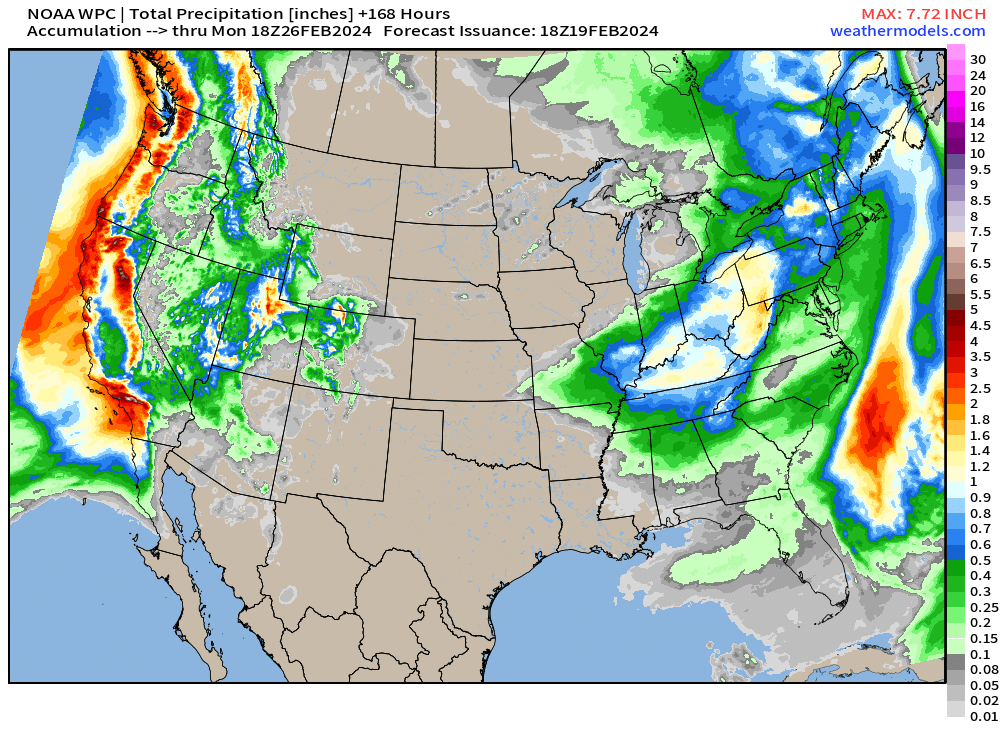
Very dry conditions continue across the central U.S. from the Dakotas to Texas. The Western U.S. continues to be drenched and buried in snowfall for the next week, at least. However, there could be a break on the way for California later this week.
15-Day ECMWF EPS Median Snowfall

No change in the “put a cork” in winter idea from yesterday. This map goes through March 5th, so while there’s nothing climatologically stopping a snow storm, still plenty of cold in the Arctic, we’re seeing a more southerly dominated flow pattern into the eastern U.S. while the West sees troughing.
(Maps from weathermodels.com and weathertrader.com)
Thank you to my paying subscribers! Consider upgrading to a Yearly Plan if you find these updates valuable and wish to support my development at Weather Trader. As you can see, your support has paid dividends with considerable progress made to launching Weather Trader at full-tilt. There is still some work to do in the coming days/weeks. Also, it allows me to provide (usually) interesting and valuable commentary on scientific topics on X. Feel free to say hello and follow on X/Twitter (@RyanMaue)