


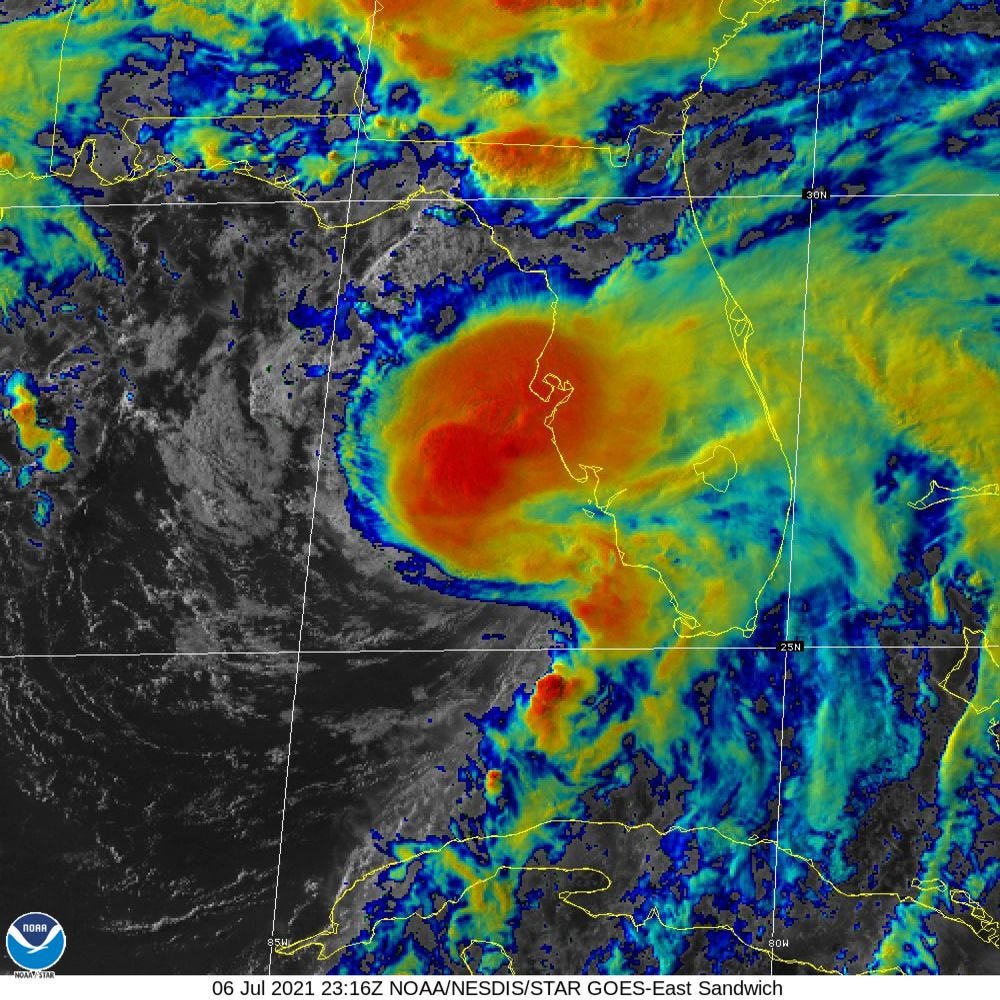
Elsa nearing landfall in Florida
Another dangerous heat dome builds over the Southwest US
The 5-pm ET update from the National Hurricane Center showed Elsa as a Tropical Storm but forecasted and warned of an impending hurricane overnight into Wednesday prior to landfall in the Big Bend of Florida. The maximum sustained winds will likely remain in the 70-80 mph range until landfall before Noon on Wednesday.
Elsa is lopsided or tilted with height as the vortex is feeling the effects of westerly component wind shear. However, that is not inhibiting Elsa from generating deep convection, showers and t-storms. If the low-level center can align itself, even briefly, under the more intense convection, then Elsa may lower its central pressure and increase wind intensity.
Maximum Wind Gust forecast from the National Weather Service for the duration of Tropical Storm (or Hurricane) Elsa.
Wind gusts of 90-mph are possible in Tampa Bay and along the immediate coastline on the eastern side of Elsa. Exposed coastal regions will certainly feel the brunt of gust winds and heavy rainfall. As with landfalling tropical systems, the right-front quadrant of the storm favors tornado spin-ups in the rain bands.


Why didn’t Elsa blow up into a major hurricane?
Some weather models showed more extreme intensification of Elsa while in the Caribbean but that did not come to pass. The ingredients necessary to build a major hurricane are quite a few, and if one negative appears, then the “heat engine” sputters at less-than-optimal performance — for a hurricane. Elsa was booking along at 25-30 mph, so the forward speed likely inhibited convection from wrapping around the center of circulation. Add to that wind shear (speed shear), dry air, and high background pressures, and Elsa failed to take advantage of the very warm ocean temperatures.
Of course, we should be thankful that Elsa did not achieve its “maximum potential” and be cognizant of the fact that historical storms on similar tracks certainly did become intense like Hurricane Dennis from early July 2005. It is much too early to draw parallels between 2021 and 2005, but no harm in exploring an similarities in the unfolding Atlantic hurricane season.
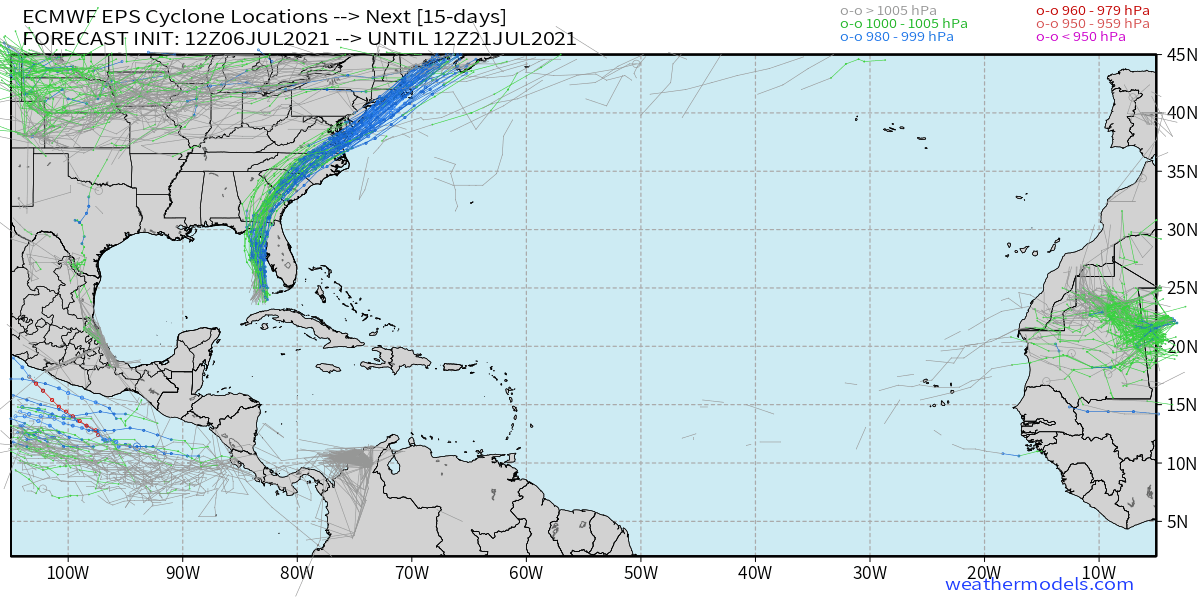
After Elsa, the next 2-weeks in the Atlantic still look quiet — and that’s not unusual for mid-July.
Eastern Pacific Ocean Hurricanes
The basin has been quiet in 2021 suggesting overall seasonal activity will be below normal. However, in 7-10 days, good potential for a couple of named systems to develop, perhaps becoming hurricanes — and harmlessly mixing fish — but positively enhancing the North American monsoon.
ECMWF EPS ensembles for the next 15-days (https://weathermodels.com)

Heat Domes
The extreme heat in the Pacific Northwest dominated the headlines prior to the holiday weekend with temperatures crushing all-time (previously observed) records. The major urban areas of Portland, Oregon and Seattle, Washington obliterated their city all-time marks.
The culprit for the extreme heat was a ridge of high pressure that was centered in southern British Columbia. The anti-cyclonic (clockwise) flow around the “heat dome” meant air parcels arrived into Portland and Seattle after descending and compressing causing drying and heating. Think of the Santa Ana winds that took Los Angeles to 113°F in October of 2012.
The temperature records were “unprecedented” in that they had not been observed in history, not even close. And, the weather pattern or heat dome has certainly happened before. But, what was unique about this event was its intensity and location: the centroid north of the Canadian / US border which allowed the extreme easterly flow to bake the populations.
Another important actor was a small cut-off low pressure off the California coast that forced southeasterly winds from the Four-Corners into Oregon.
Some are calling this a “black swan” event. I am not sure about using this term to describe a weather pattern that is easily diagnosed — meaning we know why it got so hot. It’s not a mystery. I’m continuing to dig into the historical context of the Pacific Northwest record heat but from a different point of view: using the historical ensemble databases (GEFSv12, ECMWF EPS) from 2000-2020, are there counterfactual realizations of “heat domes” that come close or exceed what was experienced at the end of June 2021? More on this as I finish downloading and processing the data. This type of analysis is fascinating and can be implemented in real-time to do counterfactual extreme event analysis.
Death Valley to 130°F? Fresno to 120°F?

The upper-level height chart at 500-hPa shows the development of a strong ridge centered over Las Vegas coming close to 6,000 meters. Fresno ensemble members are median 117°F but many solutions over 120°F from ECMWF EPS 12z. Of course, it’s hot in Fresno in July, average high is 100°F but adding 20°F to that is beyond tolerable for humans outdoors or stuck in unventilated homes.

If Death Valley wants to go to 130°F — then by all means, go for it. That’s why it’s named Death Valley.
