


December 27, 2023 Wednesday update
Hemisphere cooling down over next 2-weeks
A dramatic hemipspheric cool-down is underway, finally. If we look at the ensembles through the next 15-days, we see the mean temperature anomaly drop by over 1°F globally, finally giving back the enormous NH land warmth. This is likely a consequence of the reconfiguration of the polar vortex and moderate Stratospheric Warming event or split.
It will be a welcome change to see less red on the maps.
Northern Europe goes into the deep freeze as the extreme cold from Greenland seems to bleed over the continent. And, the southern U.S. continues to be chilly.

News:
This newsletter will rebrand as part of roll out of [WT] https://weathertrader.com in the coming weeks. Right now, the main hurdle is assembling all of the products that I have developed into a working interface. Monthly/yearly access will remain the same so I guess everyone will get access to professional products for $5/month. With ECMWF data becoming largely free in 2024, the market will quickly adjust downward in terms of cost for information. However, that means plenty of opportunity to provide value with unfettered access to ECMWF’s real-time catalogue.
A.I. model skill score: Google GraphCast + ECMWF HRES + GFS for 5-day Northern Hemisphere geopotential height forecasts
GraphCast continues to blast away at > 0.96 just above ECMWF at 0.95 and ahead of GFS at 0.93. No matter what you say, these systems are all very good models, and state-of-the-art. However, there are instances in which each may perform poorly. You can see those in the red “drop outs” with GFS — periods or instances of substantially lower skill. That is something that drags down the overall skill scores of the model and need to be fixed/removed through research and upgrades. ECMWF has largely escaped drop-outs and it appears that GraphCast does not have time for them, either.

Thursday Low Temperatures | December 28, 2023

Lower 48 average low temperature has slipped to 30°F with only 70 Million population at/below freezing. However, there is even more area (62%) of the Lower 48 below freezing, so continues to be a good example of why you should always population or energy weight for impacts.
Thursday High Temperatures + Anomaly


Florida is the “coolest” relative to climatology with temperatures more than 10°F below normal. The northern half of the Lower 48 remains unseasonably warm.
Temperature Outlook Next 2 Weeks
The 5-day Z500 height anomaly average taking us into January 1, 2024 shows a blocking pattern (Omega) with a trough over the Southeast U.S. keeping the weather much cooler than normal and unsettled. Relative and actual warmth continues across Canada for the next week. But changes are afoot, finally!

Week 1: December 27, 2023 - January 3, 2024 [EPS Mean 12z]
We’ve seen this map for a long time with +20°F anomaly over Canada on a 7-day average/chunk. That’s quite a climate footprint. However, Florida is under the trough and 7-10°F below normal.

Week 2: January 3, 2024 - January 10, 2024 [EPS Mean 12z]
Finally, the Canadian Arctic sees cooler than normal air-mass development. This may indeed be the shift to a much colder and wintry pattern by mid-January across the entire Lower 48 as a weak to moderate Stratospheric Warming and split polar vortex event reaches its crescendo.

7-Day Precipitation Outlook
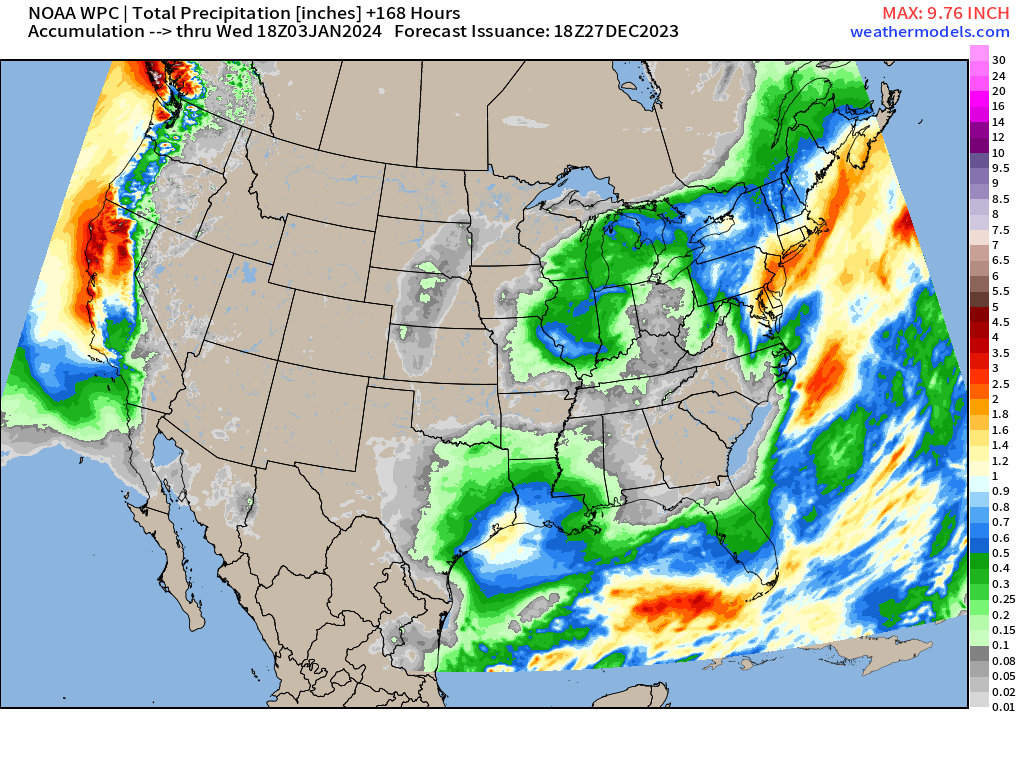
7-day rainfall outlooks looks quite similar to yesterday with extended dryness (no snow) across the Rockies. However, rain/snow along the West Coast will be quite welcome especially in the California Sierra.
The precipitation in the Northeast is all rain over the next 24-36 hours, of course. Not enough cold air.
2-inches+ of rainfall in NYC, and a large area forecasted to see over an inch from D.C. to Boston. Not exactly what you’d expect in late-December!

Snowfall Forecast Next 15-days

The probability of 3-inches or more falling from the ECMWF EPS 12z forecast across the Lower 48 in the next 15-days. I’d say we are seeing more colors on the map, especially looking into the period from Jan 4-11.
Note: when you see snowfall probabilities across Southern states:
There is non-zero but not much better chances for snowfall across the Southern USA. Again, we do not sound the alarm since this not actionable unless the values really increase to 50% in the short and medium-range e.g. 3-7 days.

We usually do ensemble sorting and not averaging [ensemble means] in the medium and long range b/c so many zero events get mixed in. It would be better to caveat the snowfall amounts by “if if snows, then how much” and then provide a % chance of snow, and a range of outcomes. More on that with Weather Trader products to come.
2024 Global Tropics
Still all quiet in the tropics. Ghost town across the Southern Hemisphere, which is not what we expect in an El Nino summer in the Southern Hemisphere.
All maps are probably from weathermodels.com (please subscribe there for affordable, professional, and beautiful weather maps).
Thank you to my paying subscribers!
Your support pays for my Linux servers and product development including (coming soon) weathertrader.com.
This blog will rebrand as an underlying component of the overall WT banner.
Also, it allows me to provide (usually) interesting and valuable commentary on scientific topics on X. Feel free to say hello and follow on X/Twitter (@RyanMaue)