


December 26, 2023 Tuesday update
A.I. modeling updates
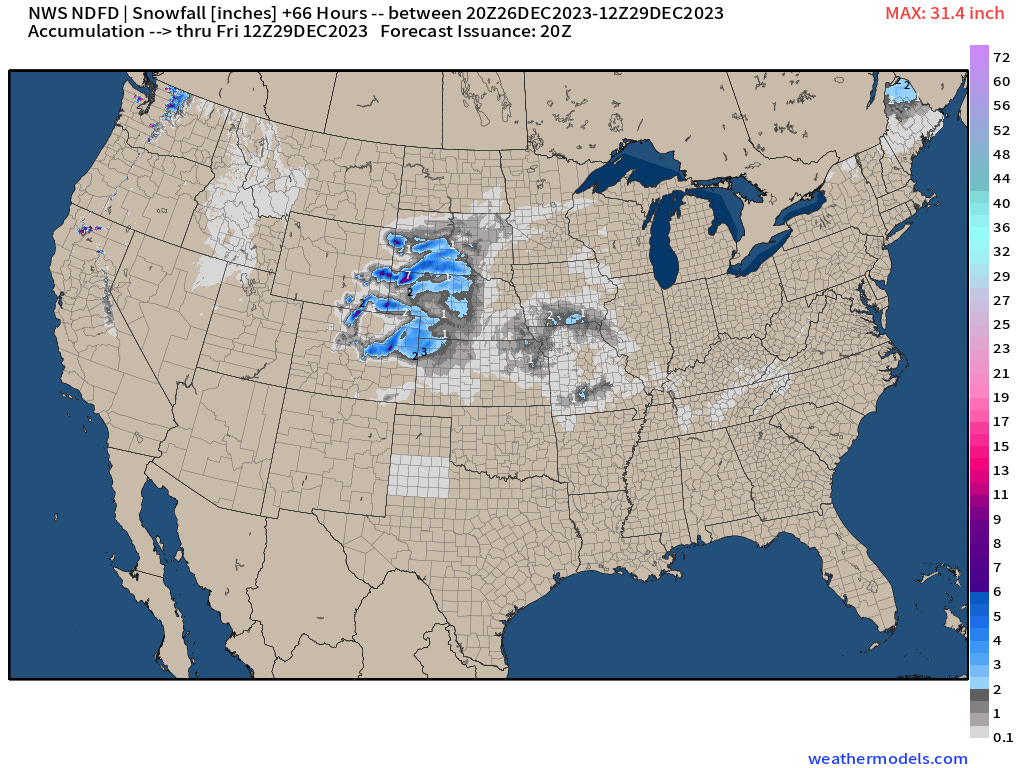
Winter storm continues to spin over the central Plains heading into Missouri on Wednesday. Looking at the NWS accumualation forecast and I’m wondering if the snowfall shown in this HRRR 18z model simulation is legit on eastern Iowa.
NWS Snowfall Accumulation forecast through the next 2-3 days. Light amounts generally.
News:
This newsletter will rebrand as part of roll out of [WT] https://weathertrader.com in the coming weeks. Right now, the main hurdle is assembling all of the products that I have developed into a working interface. Monthly/yearly access will remain the same so I guess everyone will get access to professional products for $5/month. With ECMWF data becoming largely free in 2024, the market will quickly adjust downward in terms of cost for information. However, that means plenty of opportunity to provide value with unfettered access to ECMWF’s real-time catalogue.
Email Size Limits:
I realize that these newsletter updates are huge, and may be filling up your inbox. I am tinkering with Substack’s unofficial API to see if I can offload the images to cache or hot link to my own server at WT.
A.I. modeling update
During the Christmas weekend, I experimented with various A.I. global weather models to judge their capability of providing valuable and actionable forecast information that a professional user might need for commodities, energy or transportation.
First, let’s jump in the time machine and go back to 1950. Obviously the Earth’s climate was significantly cooler by about 1°C so no surprise to see the geopotential heights much lower in the tropics compared to the modern 1991-2020 climatology.
Pangu-Weather can easily recreate the weather from 7-decades ago, even back to 1940 from the ERA5 reanalysis or any other time period for which you have the requisite initial conditions (gridded data). This period in November 1950 is outside of the training data from the ERA5 used by Pangu-weather (1979-2020).

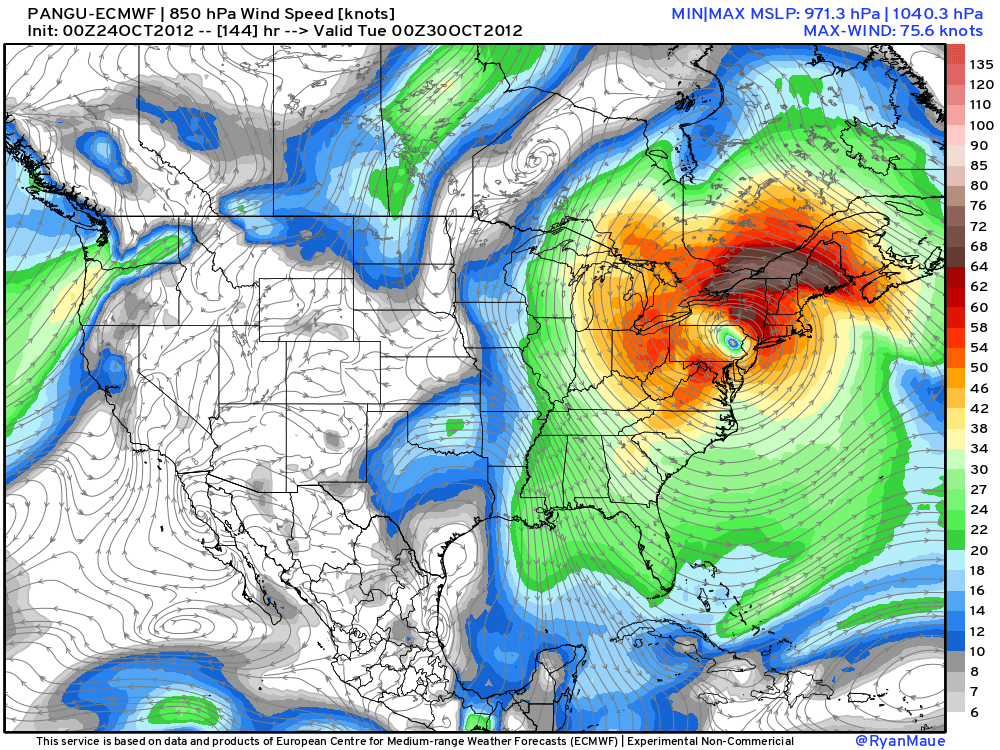
What about Hurricane Sandy from October 2012. Absolutely. Pangu-Weather has no trouble dialing up the correct forecast track and timing of landfall 6-days in advance. Holy cow!
I do not know for certain if the success of this forecast is because it is within the training data [Pangu can see the answer key] or if it is legitimately capable of “nailing Sandy” like the Euro did in 2012 intensifying the so-called “model wars” between GFS and the ECMWF model.
This can be run with real-time data, so certainly out of the training sample. I am very impressed with Pangu Weather and GraphCast skill for large-scale features out to 10-days.
Second, let’s look at FourCastNetv2 from NVIDIA but extend out to 30-days. FourCastNetv2 can run very fast on a non-GPU system using 8-16 threads and finish this 30-day inference in 20-minutes.
At first glance, this forecast at Day 30 looks like any other conventional weather model output especially with details of the air masses. This is more akin to looking at one ensemble of the ECMWF EPS or GEFSv12 rather than the ensemble mean.
The various A.I. modeling systems produce fine vs. smooth output depending upon how they attempt to minimize RMSE error going through the forecast process.
Note, the climatology is maintained into January 20, 2024. I don’t think this has much of a bias. Again, I am astounded.
FourCastNet v2 is completely open-source so the model and training weights can be used for commercial purposes. That is currently not the case for Google’s GraphCast or Pangu-Weather. Not sure about FuXi.

Wednesday Low Temperatures | December 27, 2023

Lower 48 average low temperature is 31°F with only 71.5 Million population at/below freezing. However, there is 58% of the real estate of the Lower 48 below freezing, so a good example of why you should always population or energy weight for impacts.
Wednesday High Temperatures
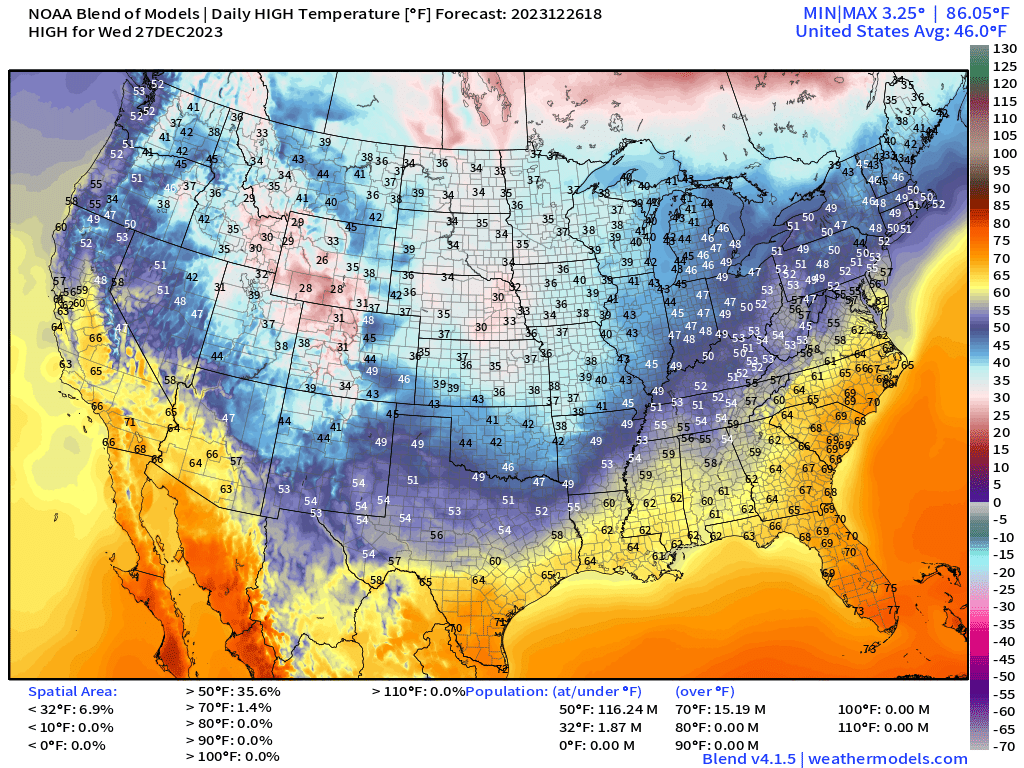
60s sneaking up into Delaware tomorrow. Cooler air behind the winter storm will slowly edge eastward across the Mississippi. What a pathetic excuse for an Arctic blast. Only 2 Million Americans in Lower 48 at/below freezing.
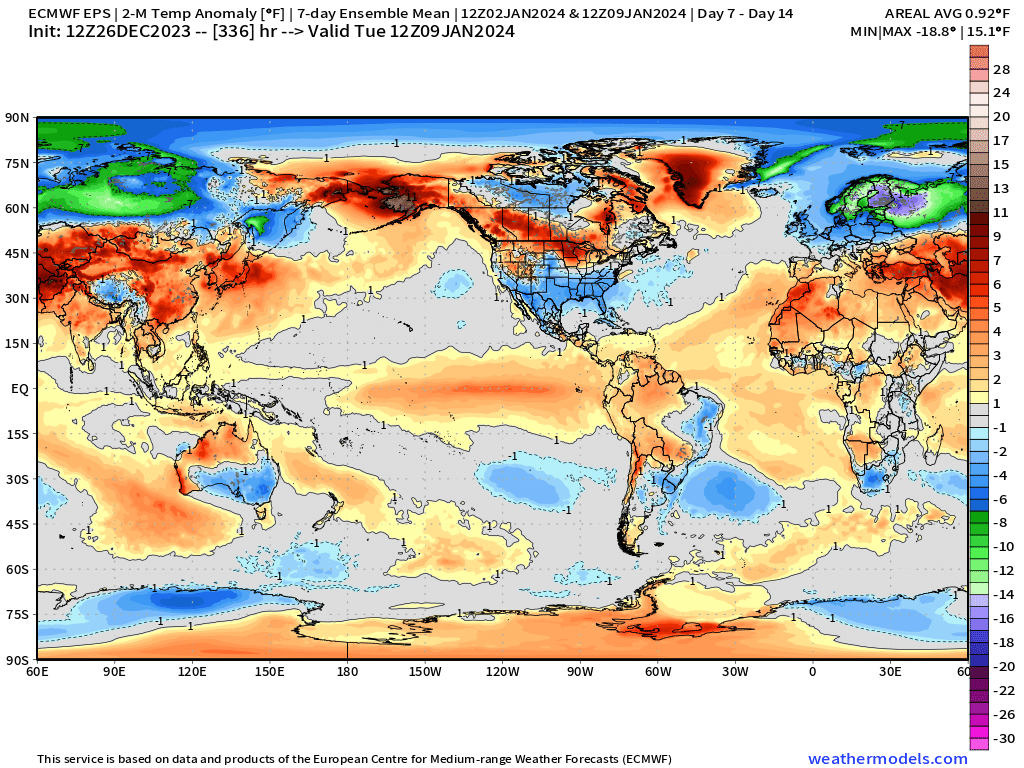
Temperature Outlook Next 2 Weeks
Greenland is cold but the Northern Hemisphere continents are very, very warm compared to normal. Wow those are huge anomalies. BUT, even with all that red on the maps, it averages out to 1.38°F above normal which is the lightest yellow on the color table if it were colored by only one value — the global average anomaly.
Week 1: December 26, 2023 - January 2, 2024 [EPS Mean 12z]

Week 2: January 2, 2024 - January 9, 2024 [EPS Mean 12z]
7-Day Precipitation Outlook
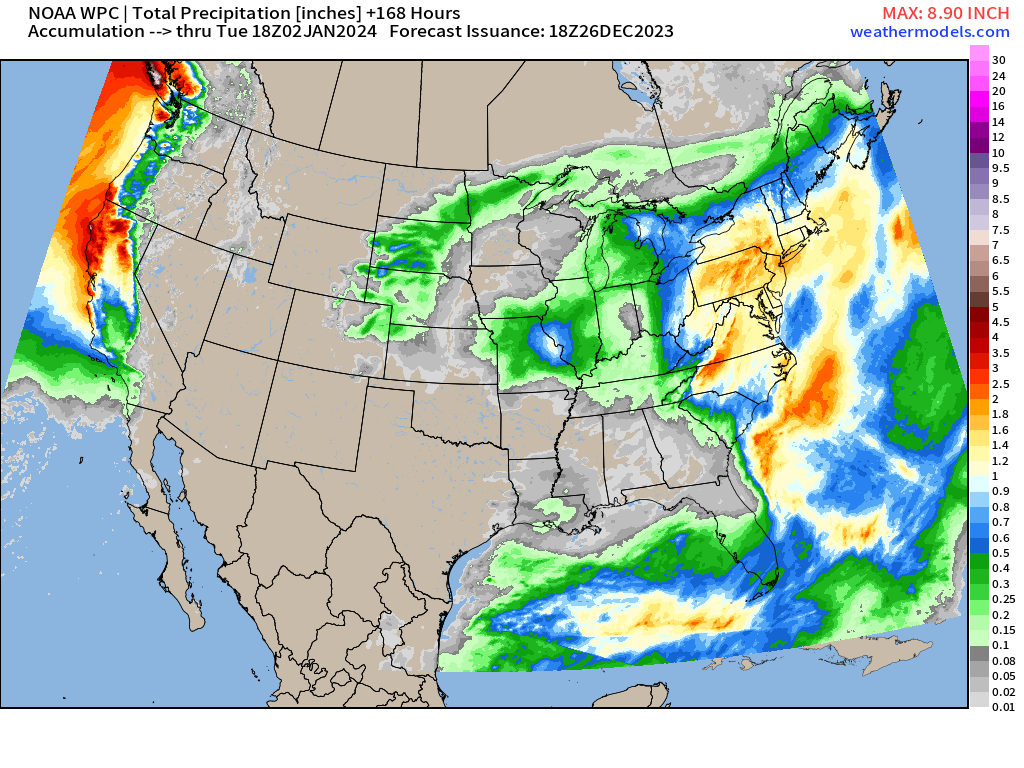
The Rockies will be very dry over the next 7-days. Good to see continued precipitation extending into California. Again, this is still not snow in the Mid-Atlantic.
Snowfall Forecast Next 15-days
Probability of 3-inches or more falling from the ECMWF EPS 12z forecast across the Lower 48 in the next 15-days.
There is non-zero but not much better chances for snowfall across the Southern USA. Again, we can’t really sound any alarm since this not actionable unless the values really increase to 50% or so.
We’ll keep watching for hints of winter storm activity but the overall upper-level pattern is not conducive for intense winter storms aside from the cut-off low thing spinning and dying in the Plains. The jet stream is just not in any sort of mood to invigorate a “bomb cyclone” or Nor’easter — and even if it did, there’s no cold air.


Median snowfall amounts from ensembles through 10-days is not going to satisfy very many folks looking to make a snowman or enjoy winter sports. Why? El Nino!
2024 Global Tropics
All quiet in the tropics. Ghost town across the Southern Hemisphere!
Thank you to my paying subscribers! Your support pays for my Linux servers and product development including (coming soon) weathertrader.com. This blog will rebrand as an underlying component of the overall WT banner.
Also, it allows me to provide valuable commentary on scientific topics on X. Feel free to say hello and follow on X/Twitter (@RyanMaue)